TL;DR:
- Microsoft Power BI transforms raw data into interactive reports and dashboards, serving as a key analytics tool within the Microsoft Fabric ecosystem. It comprises three main components: Desktop for report creation, Service for cloud sharing, and Mobile App for on-the-go access, with licensing required for collaboration. Power BI connects to numerous data sources and enables automated data refreshes, helping business professionals make real-time, data-driven decisions easily.
Microsoft Power BI is defined as an integrated business analytics platform that transforms raw data into interactive visual reports and dashboards. Part of the Microsoft Fabric ecosystem, it connects to dozens of data sources, models that data, and publishes the results to any device. For business professionals and decision-makers in Saudi Arabia and the UAE, understanding what is Microsoft Power BI means recognizing a tool that replaces static spreadsheets with live, shareable intelligence. Power BI Desktop handles report creation locally, Power BI Service manages cloud publishing and collaboration, and the Power BI Mobile App delivers those reports to executives on the move.
What are the main components of Microsoft Power BI?
Power BI’s three-component structure covers every stage of the analytics workflow, from building a report to consuming it on a phone. Each component has a distinct role, and together they form a complete end-to-end system.
- Power BI Desktop is a free Windows application for designing reports, building data models, and writing calculations. You download it, connect to your data, and build visuals without paying anything.
- Power BI Service is the cloud platform where you publish, share, and collaborate on reports. Sharing reports across an organization requires a Pro or Premium license.
- Power BI Mobile App runs on iOS and Android, giving executives and field teams read access to dashboards from anywhere.
Licensing is the detail that surprises most new users. Power BI Desktop is free, but collaboration and sharing through Power BI Service require Pro or Premium licenses. Pro suits most mid-size teams, while Premium is built for large enterprises that need dedicated capacity and advanced AI features.
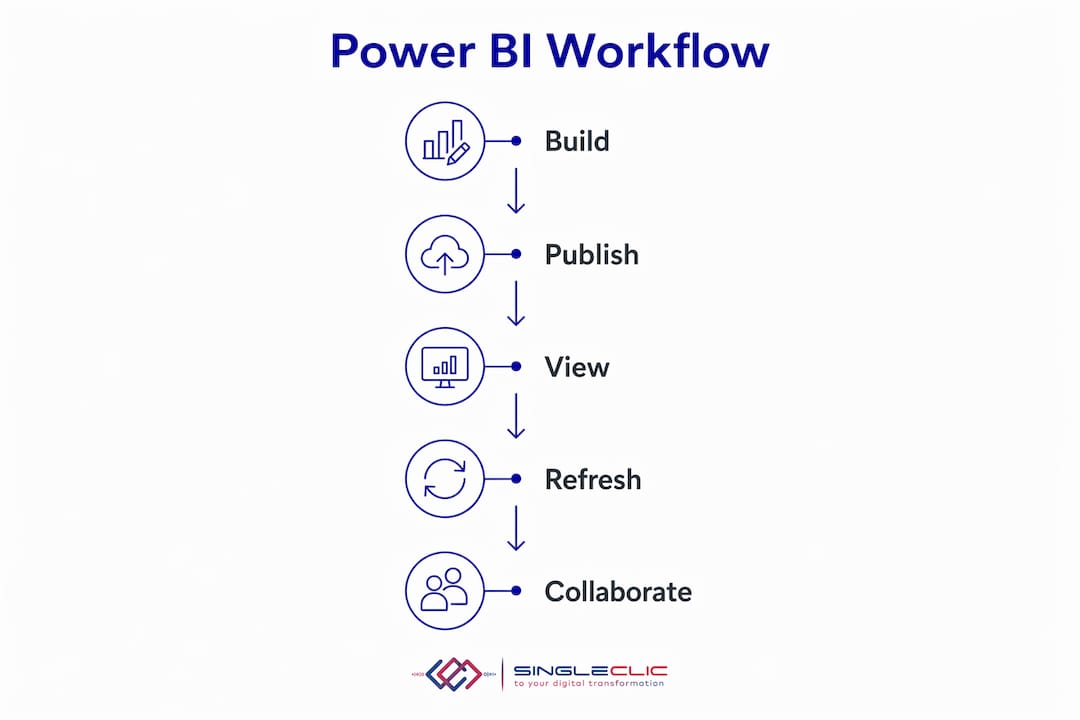
The workflow follows a logical sequence. You build in Desktop, publish to Service, and your colleagues view the result in a browser or the Mobile App. Governance, row-level security, and scheduled data refreshes all live in Service, which is why the cloud license matters for enterprise deployments.

Pro Tip: Start with Power BI Desktop before purchasing any license. Build two or three reports on your own data first. You will know exactly which Service features you need before committing to a plan.
Which data sources can Power BI connect to?
Power BI integrates with a wide range of data sources, including relational databases, web pages, PDFs, and structured files. That breadth matters for organizations in KSA and UAE that run mixed technology environments combining legacy ERP systems, cloud platforms, and local file servers.
Supported source types include:
- Structured files: CSV, XLSX, XML, and JSON
- Databases: SQL Server, Oracle, MySQL, and PostgreSQL
- Cloud services: Azure, SharePoint, and Dynamics 365
- Web and APIs: REST APIs, OData feeds, and web pages
- Unstructured sources: PDFs and Excel workbooks with multiple sheets
Power BI does not alter your source data. It reads, models, and visualizes without writing back to the original system. That read-only approach protects data integrity, which is a real concern for regulated industries like banking and healthcare across the Gulf region.
Scheduled refresh is one of Power BI’s most practical features for operations teams. You configure a refresh cadence in Power BI Service, and the platform pulls updated data automatically. A procurement dashboard in Riyadh can reflect that morning’s purchase orders without anyone manually exporting a file. For organizations exploring how data drives growth, automated refresh is the feature that converts a one-time report into a living business asset.
How does Power BI help business professionals make better decisions?
Power BI targets business analysts and marketers, not developers. That design choice lowers the barrier to entry and enables broader adoption across finance, operations, HR, and sales teams without requiring a dedicated IT resource for every report.
The drag-and-drop interface handles most standard reporting needs. You select a visual type, drag a field onto it, and Power BI renders the chart. Advanced calculations use DAX (Data Analysis Expressions), a formula language similar to Excel functions, but DAX is optional for basic reporting. Most business users never need to write a single DAX formula to build useful dashboards.
The contrast with Excel is significant. Power BI handles millions of rows of data where Excel typically struggles beyond 100,000 rows. That scale difference means a regional sales director can analyze three years of transaction data across five countries in a single report, something that would crash a standard Excel workbook.
| Capability | Excel | Power BI |
|---|---|---|
| Data volume | Up to ~100,000 rows comfortably | Millions of rows |
| Sharing | File attachments or SharePoint | Live published reports with access control |
| Refresh | Manual | Scheduled automatic refresh |
| Interactivity | Limited pivot tables | Fully interactive cross-filtering dashboards |
| Governance | Minimal | Row-level security and audit logs |
Power BI moves decision-makers from static spreadsheets toward real-time interactive insights that reveal patterns and trends. That shift changes how leadership meetings run. Instead of reviewing a PDF report prepared the night before, executives interact with live data and ask follow-up questions on the spot.
Pro Tip: Connect your Power BI reports to real-time dashboards for operational data like logistics or customer service queues. The live view changes how quickly teams respond to problems.
What are the best first steps for Power BI beginners?
Beginners can build their first professional Power BI report in 30 minutes to 3 hours by connecting to Excel data, cleaning it in Power Query, and building interactive visuals. Most users reach a working level of confidence within their first week.
Follow these steps to get started without wasting time on common mistakes:
- Download Power BI Desktop. It is free from the Microsoft website. No account is required to start building.
- Connect to a familiar dataset. Use an Excel file you already know. Familiar data helps you spot errors quickly.
- Choose “Transform Data,” not “Load.” Selecting “Load” skips Power Query, which means you lose the chance to clean and reshape data before it enters your model. Always open Power Query Editor first.
- Clean your data in Power Query. Remove blank rows, fix column data types, and rename columns to plain language. Fifteen minutes here saves hours of confusion later.
- Build one simple visual at a time. Start with a bar chart or a card showing a single KPI. Add complexity only after the basic report works correctly.
- Publish to Power BI Service. Share the report with one colleague and ask for feedback. Real feedback from a real user improves your next report faster than any tutorial.
Excel and Power BI are complementary tools, not replacements for each other. Excel handles ad-hoc analysis and quick calculations. Power BI handles repeatable, automated, enterprise-level reporting with security and governance. Organizations in the UAE and KSA that treat both tools as part of the same analytics stack get more value from each.
Pro Tip: Your first Power BI project should solve a problem you already have, not demonstrate every feature. A single dashboard that answers one real business question builds more internal support than a complex report nobody uses.
For a deeper look at how Power BI connects to executive decision-making, the Power BI for executive decisions guide covers how leadership teams in the region are using the platform to replace gut-feel decisions with data-backed ones.
Key Takeaways
Microsoft Power BI is the most accessible enterprise analytics platform available today, and its value multiplies when connected to live data sources, governed through Power BI Service, and adopted across business teams rather than isolated in IT.
| Point | Details |
|---|---|
| Three-component structure | Power BI Desktop, Service, and Mobile App each serve a distinct role in the analytics workflow. |
| Licensing reality | Desktop is free; sharing and collaboration require Pro or Premium licenses through Power BI Service. |
| Data scale advantage | Power BI handles millions of rows where Excel struggles, making it the right tool for enterprise reporting. |
| Beginner’s critical step | Always choose “Transform Data” over “Load” to access Power Query and clean data before modeling. |
| Excel and Power BI coexist | Use Excel for ad-hoc analysis and Power BI for repeatable, automated, governed reporting. |
Power BI in the Gulf: what I’ve seen actually work
Working with enterprise clients across Saudi Arabia and the UAE, I have watched organizations deploy Power BI in two very different ways. The first group treats it as a reporting tool and builds beautiful dashboards that nobody checks after the first month. The second group treats it as a decision infrastructure and ties every report to a specific business question that someone is accountable for answering.
The difference is not technical. It is organizational. Power BI’s drag-and-drop interface is genuinely easy to learn. The harder work is agreeing on which metrics matter, who owns each report, and what action follows from each insight. That governance conversation has to happen before the first dashboard goes live.
I also see teams underestimate the value of integrating Power BI with their ERP and CRM systems. When Power BI pulls directly from Dynamics 365, the BI and ERP integration creates a single source of truth that finance, operations, and sales can all trust. That trust is what makes data-driven decisions stick.
One more observation: the Microsoft Fabric ecosystem is evolving fast. Power BI is no longer just a visualization layer. It is becoming the front end for a broader data platform that includes data engineering, real-time analytics, and AI-generated insights. Organizations that adopt Power BI now are building the foundation for that broader capability. Starting with a well-governed Power BI deployment is the right first move, even if the broader Fabric features come later.
— Tamer Badr
How Singleclic helps organizations get real value from Power BI
Singleclic deploys Microsoft Power BI as part of a connected analytics stack that includes Dynamics 365 ERP and CRM, workflow automation, and the Cortex low-code platform. For organizations in Saudi Arabia and the UAE, that means Power BI reports draw from live ERP data, CRM pipelines, and operational workflows, not from manually exported files.
Singleclic’s team of 70+ consultants and engineers has delivered analytics solutions for clients including Emirates Health Services, QNB, and Emaar Misr. The approach starts with your existing data sources and business questions, then builds a governed Power BI environment that scales with your organization. If you are evaluating how analytics fits into a broader Microsoft Dynamics 365 strategy, Singleclic’s team can map the integration path from your current systems to a fully connected data platform.
FAQ
What is Microsoft Power BI used for?
Microsoft Power BI is used to connect to business data sources, model that data, and publish interactive visual reports and dashboards. Organizations use it for sales performance tracking, financial reporting, operational monitoring, and executive decision-making.
Is Power BI free to use?
Power BI Desktop is free to download and use for building reports. Sharing and collaborating through Power BI Service requires a Pro or Premium license, which is a paid subscription.
How is Power BI different from Excel?
Power BI handles millions of rows of data and supports scheduled automatic refresh and enterprise-level security, while Excel is better suited for ad-hoc analysis and smaller datasets. The two tools are complementary rather than replacements for each other.
Do I need coding skills to use Power BI?
No coding skills are required for standard Power BI reporting. The drag-and-drop interface covers most business use cases, and advanced calculations using DAX are optional for users who need complex custom metrics.
How long does it take to learn Power BI basics?
Most business users can build their first working report within 30 minutes to 3 hours using familiar data. Reaching a confident working level typically takes one week of hands-on practice with real datasets.
Recommended
- Power BI for Executive Decision-Making: Turning Data into Action | Singleclic
- From Data to Decisions: How Power BI Accelerates Insight and Action | Singleclic
- From Data to Decisions: Power BI and Enterprise Analytics That Drive Strategy | Singleclic
- What Is Microsoft Dynamics CRM? A Guide for GCC Leaders