This tutorial delivers one outcome: a scoped, validated process map ready to feed ERP/CRM integrations or Cortex low-code workflows. Your map passes when it has an explicit trigger, named lane owners, labeled decision points, a documented system of record, and at least three measurable acceptance tests signed off by the process performers.
SAP Signavio’s process mapping guidance frames this precisely: formal process mapping must surface roles, responsibilities, and system interactions, not just the sequence of steps. That distinction separates a diagram on a whiteboard from an artifact your integration architect can actually use. Singleclic applies BPMN notation and a structured mapping cycle on every ERP and CRM engagement to close that gap.
Table of Contents
- Why you must map before you automate or integrate
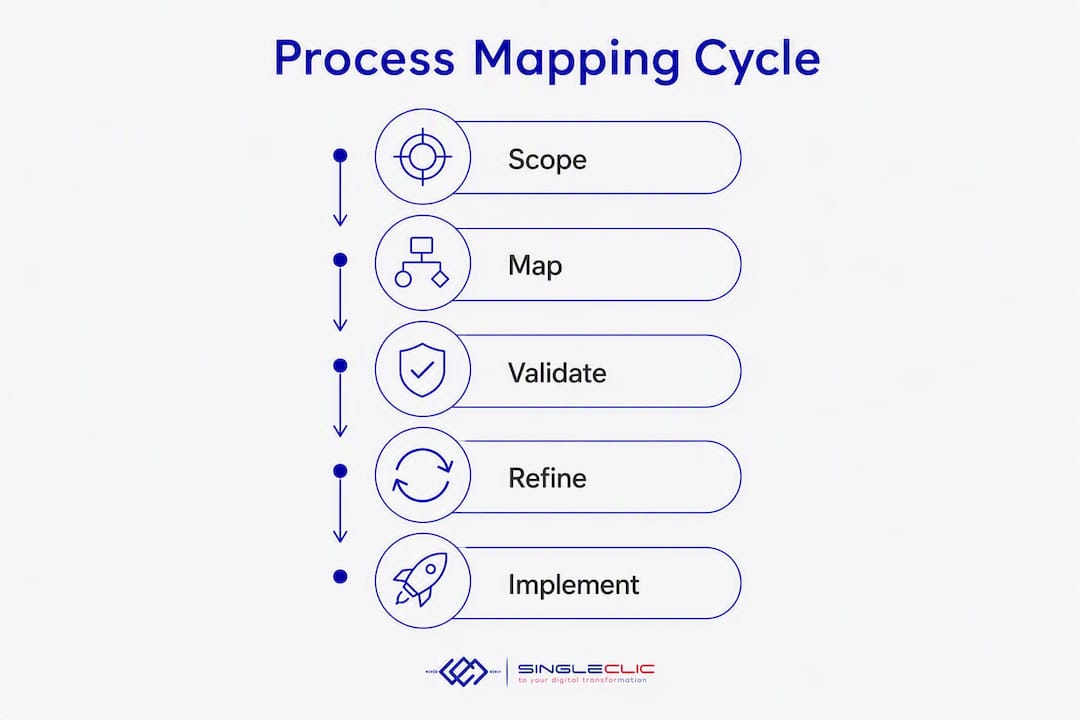
- Step-by-step process mapping cycle you can run this quarter
- What symbols to use and when to adopt BPMN
- Common mapping failures and how to control scope
- How to use your process map to select automation candidates
- Which tools and templates should you use?
- How execs convert process maps into funded automation projects
- Key Takeaways
- Singleclic’s approach to enterprise mapping engagements
- Useful sources and further reading
Why you must map before you automate or integrate
Most enterprise automation projects stall not because the technology fails, but because the process was never clearly defined before configuration began. Formal process mapping validates workflows and clarifies handoffs before ERP/CRM integration or low-code migration, giving your project team a shared, unambiguous baseline.
The practical difference between a flowchart and enterprise process mapping comes down to three things: roles, responsibilities, and system interactions. A flowchart shows what happens. A process map shows who does it, which system holds the record, and where ownership transfers. For ERP and CRM integration, that distinction is the difference between a successful go-live and a six-month rework cycle.

Three strategic benefits follow directly from that rigor. First, swimlane maps make handoff boundaries visible, so integration architects know exactly where data must cross system boundaries. Second, mapping exposes data silos and duplicate entry points, which become the highest-priority automation candidates. Third, the completed map produces the functional requirements your ERP or low-code configurator needs, cutting discovery time on the implementation side.
Step-by-step process mapping cycle you can run this quarter
A structured cycle keeps your mapping engagement on track and produces artifacts your IT team can use immediately. Effective process mapping follows a defined sequence: scope, engage, document, analyze, and design.
Mapping cycle checklist:
- Pick the process. Choose one process with a single trigger and a single outcome. Avoid bundling related processes into one map.
- Define scope. Write a one-sentence scope statement: “This map begins when [trigger] and ends when [outcome].”
- Identify roles, inputs, and outputs. List every role that touches the process and every system that holds data.
- Run an as-is workshop. Bring performers together for 90 minutes. Capture the current state on a shared canvas, not from memory alone.
- Document exceptions. Note the top three exception paths; leave rare edge cases for a later iteration.
- Analyze bottlenecks. Mark steps with high wait time, manual rework, or duplicate data entry.
- Design the to-be state. Redesign the flow with automation and integration points labeled.
- Define KPIs and acceptance tests. Specify at least three measurable criteria the automated process must meet.
- Assign an owner and set a review cadence. Every map needs one named owner and a scheduled review date.
Validation and acceptance criteria:
| Map element | Pass condition | Fail condition |
|---|---|---|
| Trigger | Explicitly named event or data condition | “Process starts when needed” |
| Lane ownership | Named role per lane, not a person’s name | Unnamed or shared lanes |
| Decision points | Labeled with Yes/No or condition text | Unlabeled diamond |
| System of record | Named system per data object | “System TBD” |
| Acceptance tests | Three measurable, time-bound criteria | No criteria defined |
Sample engagement timeline (single process):
| Week | Activity | Deliverable | Owner |
|---|---|---|---|
| 1 | Scope brief and stakeholder list | Scope document | Process owner |
| 2 | As-is workshop | Draft as-is map | Process analyst |
| 3 | Bottleneck analysis and to-be design | To-be map | Process analyst + IT lead |
| 4 | Validation and sign-off | Signed map + acceptance tests | Steering sponsor |
Pro Tip: Map one trigger and one outcome per diagram. Teams that try to map an entire department in one session consistently produce maps too large to validate or automate. Start small, deliver fast, then drill down.
What symbols to use and when to adopt BPMN
You do not need thirty symbols to produce a useful enterprise map. Start with six.
- Oval (terminal): marks the start event and the end event.
- Rectangle (activity/task): represents any action performed by a role.
- Diamond (gateway/decision): shows a branching point with labeled conditions.
- Parallelogram (input/output): represents a document, form, or data object entering or leaving a step.
- Arrow (sequence flow): connects steps in order and shows direction.
- Swimlane (role boundary): a horizontal or vertical band that groups all tasks belonging to one role or system.
Example: purchase requisition map. The Requester lane contains a rectangle labeled “Submit PR form” connected by an arrow to a diamond labeled “Budget available?” In the Finance lane, a “Yes” path leads to “Approve in ERP” (rectangle with the ERP system label in the corner). A “No” path leads to “Return with comments.” The Procurement lane receives an approved PR document (parallelogram) and begins “Issue PO.” Each lane boundary makes the handoff explicit and tells your integration architect exactly where the ERP must receive or emit a record.
SAP Signavio recommends a tiered approach: Level 1 enterprise maps for executive alignment, Level 3 workflow maps for automation candidates, and Level 4 or 5 activity artifacts only for processes going directly into a low-code engine like Cortex. BPMN becomes the right choice at Level 3 and below, when a developer or configurator will consume the model.
Common mapping failures and how to control scope
The top cause of failed mapping initiatives is scope that is too large. Teams attempt to map an entire order-to-cash cycle in one session and produce a diagram no one can validate or maintain.
Typical failure modes:
- Scope covers multiple triggers and outcomes in a single diagram.
- Symbols are used inconsistently across team members or sessions.
- Lanes represent individuals rather than roles, making maps obsolete when staff changes.
- Maps are completed once and never reviewed, going stale within months.
- Teams model the policy (“should happen”) rather than the actual process (“does happen”).
Rules of engagement:
- One trigger, one outcome per map.
- One named owner per map, responsible for accuracy and review.
- Lanes represent roles or systems, never individual people.
- Capture the main flow and the top three exceptions first; add rare paths in a second iteration.
- Set a review date at sign-off, tied to your change control calendar.
Splitting an over-scoped map: If your team has drafted a map covering supplier onboarding, purchase requisition, approval, PO issuance, goods receipt, and invoice matching in one diagram, split it. Create a Level 1 overview showing the six phases as labeled rectangles with arrows. Then create a separate Level 3 map for each phase that will be automated. The Level 1 map gives executives context; the Level 3 maps give your integration team precision.
How to use your process map to select automation candidates
A completed map is a diagnostic tool. It reveals information silos and manual handoffs that are prime targets for automation. Use the following checklist to score each candidate process before committing resources.
Automation-readiness checklist:
- Volume: Does this process run more than 50 times per month?
- Repeatability: Are the steps identical or near-identical each time?
- Data availability: Is the input data already in a structured system?
- Decision logic clarity: Can every decision be expressed as a rule with no subjective judgment?
- Exception rate: Are exceptions fewer than 15% of cases?
- Regulatory controls: Are compliance requirements documented and stable?
- Integration touchpoints: Are the source and target systems identified on the map?
Effort vs. impact decision matrix:
| Process | Manual steps | Handoff frequency | Exception rate | Automation impact | Implementation effort |
|---|---|---|---|---|---|
| PR approval | 6 | 4 per cycle | Low | High | Low |
| Vendor onboarding | — | 8 per cycle | Medium | High | Medium |
| Invoice matching | 9 | 3 per cycle | Low | High | Low |
| Contract renewal | 5 | 2 per cycle | High | Medium | High |
Populate this matrix directly from your map evidence: count the rectangles (manual steps), count the lane crossings (handoffs), and note exception paths. Processes with high impact and low effort go first.
Map-derived acceptance tests become your automation user-acceptance criteria. The most effective acceptance tests come directly from the map: examples include a source-of-truth record created in the ERP within two minutes of approval, no duplicate record created across CRM and ERP, and SLA met at the handoff step where delays previously occurred. For ERP integration patterns, these tests translate directly into system test scripts.
Which tools and templates should you use?
Essential artifacts (produce these for every mapping engagement):
- Scope brief: one page, defines trigger, outcome, in-scope roles, and out-of-scope items. Owner: process owner.
- SIPOC diagram: suppliers, inputs, process, outputs, customers. Owner: process analyst.
- As-is map: current state with bottlenecks marked. Owner: process analyst.
- To-be map: future state with automation and integration points labeled. Owner: process analyst + IT lead.
- Exceptions register: top exceptions with handling logic. Owner: process owner.
- KPI table: three to five metrics with baseline and target values. Owner: process owner.
- Acceptance tests: three or more measurable criteria. Owner: IT lead + QA.
- Version history and owner field: embedded in the map file. Owner: process analyst.
Tool selection checklist for enterprise teams:
- Real-time collaboration for distributed teams across KSA, UAE, or Egypt.
- Version control with named revisions and rollback.
- BPMN support for executable models handed to developers.
- Export formats compatible with your low-code platform (PDF, BPMN XML, SVG).
- Access controls that separate viewer, editor, and approver roles.
- Integration or connector support for platforms like Cortex, Microsoft Dynamics 365, or Odoo.
Dedicated process mapping tools add version control, role-based views, and reuse that whiteboards and slide decks cannot provide at enterprise scale. Microsoft Visio, Lucidchart, and ARIS are widely used for BPMN-level work. For teams moving mapped processes directly into low-code automation, choose a tool that exports BPMN XML your platform can consume without manual rework.
Pro Tip: Treat your process map repository the same way you treat your code repository. Every map gets a version number, a named owner, and a scheduled review date. Maps without owners go stale and become liabilities, not assets.
How execs convert process maps into funded automation projects
Moving from a validated map to a funded pilot requires a one-page business case your PMO or CIO office can act on. Structure it around these nine elements.
- Business objective: one sentence linking the process to a strategic goal.
- Scope statement: trigger, outcome, and in-scope roles.
- Expected benefits: quantified where the map provides evidence (e.g., reduce approval cycle from five days to one day).
- Estimated effort: weeks, roles, and licensing costs.
- Named process owner: accountable for requirements and sign-off.
- Risk summary: top two risks and mitigations.
- Required integrations: list ERP, CRM, and Cortex touchpoints explicitly.
- Pilot success criteria: the acceptance tests from the map.
- Go/no-go decision gate: date and decision-maker.
Pilot plan outline:
- Weeks 1–2: finalize to-be map and acceptance tests.
- Weeks 3–5: configure automation in Cortex or Dynamics 365; build integration connectors.
- Week 6: user acceptance testing against map-derived criteria.
- Week 7: go/no-go review with steering sponsor.
Governance should include a steering sponsor who owns the business case, a delivery lead who owns the timeline, and a map-review cadence tied to your change control calendar. For effective business process management, that cadence typically runs quarterly for stable processes and monthly during active automation delivery.
Key Takeaways
A scoped, performer-validated process map with named system-of-record labels and measurable acceptance tests is the single prerequisite for a successful ERP, CRM, or low-code automation project.
| Point | Details |
|---|---|
| Scope small | Map one trigger and one outcome per diagram to keep validation and delivery manageable. |
| Validate with performers | Run an as-is workshop with the people who do the work, not just managers or IT. |
| Map handoffs explicitly | Label every lane crossing with the system of record to give integration architects clear requirements. |
| Tie maps to acceptance tests | Derive at least three measurable acceptance criteria directly from the map before automation begins. |
| Maintain maps as living assets | Assign one named owner and a review cadence; an unmaintained map becomes a liability within months. |
Singleclic’s approach to enterprise mapping engagements
The pattern Singleclic sees most often in MENA enterprises is a capable IT team that has already attempted process documentation, usually in PowerPoint or Visio, but whose maps lack lane ownership, system labels, and acceptance criteria. The result is an ERP or CRM implementation that starts configuration before the process is agreed, then absorbs weeks of rework when the business rejects the first build.
On a typical engagement, Singleclic supplies a process analyst to facilitate the as-is and to-be workshops, an integration architect to label system-of-record fields and map data flows to Dynamics 365, Odoo, or Cortex, and a low-code developer who converts the to-be map into a working prototype within the same four-week cycle. Deliverables include a signed scope brief, both maps in BPMN XML, an exceptions register, and a set of acceptance tests the business owner has approved before a single line of configuration is written.
The governance model is straightforward: a steering sponsor from the business, a delivery lead from IT, and a map-review date locked into the project plan. For organizations in Saudi Arabia and the UAE preparing for large-scale ERP rollouts, that governance structure has consistently reduced integration rework and accelerated go-live timelines.
If you are preparing a process automation or ERP/CRM integration program and want to understand how Cortex connects your mapped processes to Dynamics 365, Odoo, and legacy systems, Singleclic’s team is available to walk through your specific context. The business process automation guide for C-level leaders is a practical starting point for framing the business case internally.
Useful sources and further reading
- Lucidchart: Process map tutorial — step-by-step procedural method and symbol reference for building your first enterprise map.
- SAP Signavio: Process mapping guidance — authoritative distinction between flowcharting and formal process mapping; tiered mapping levels and BPMN guidance.
- Creately: Process mapping guide — practical walkthrough of mapping as the precursor to automation and integration.
- Prepared.cloud: Business process mapping guide — swimlane best practices, scope-control rules, and scenario-based checklists.
- monday.com: How to build a process map — tool selection guidance, version control rationale, and acceptance-test examples.
- Coursera: Business process mapping — accessible overview of map types, SIPOC, and value stream mapping for practitioners new to formal notation.
- Atlassian: Process mapping guide — seven-step creation method with stakeholder interview guidance and BPMN symbol reference.
- Asana: Process mapping steps, types, and examples — five-level mapping framework and swimlane vs. flowchart decision guidance.
- Parent Technology: ERP integration for ecommerce — integration patterns and data-flow considerations relevant to map-derived acceptance tests.