
Most executives believe business intelligence is just fancy dashboards and colorful charts. That’s a costly misconception. Real BI transforms raw operational data into strategic insights that drive confident decisions in volatile markets. Whether you’re managing construction projects in Riyadh, healthcare operations in Dubai, or banking services in Cairo, understanding how BI architecture works separates reactive management from proactive leadership. This guide breaks down BI’s core components, modern capabilities, and practical applications so you can leverage intelligence tools for measurable operational efficiency and strategic growth.
Table of Contents
- What is business intelligence?
- The building blocks: How business intelligence works
- Modern features of business intelligence platforms
- Practical benefits: BI in executive decision-making
- Evaluating and choosing the right BI solution
- Explore BI-driven digital transformation with expert partners
- Frequently asked questions
Key Takeaways
| Point | Details |
|---|---|
| BI is more than reporting | Business intelligence offers deep, actionable insights beyond basic dashboards. |
| Modern BI empowers leaders | Self-service, automation, and AI features unlock strategic value for executives. |
| Right BI solution matters | Choosing the right BI tools requires focusing on integration, governance, and regional needs. |
| BI boosts operational efficiency | Smart BI adoption supports faster, better decisions and business growth. |
What is business intelligence?
Business intelligence is the technology-driven process of analyzing data and presenting actionable information to help executives make informed decisions. Unlike simple reporting that shows what happened last quarter, BI connects multiple data sources to reveal why things happened and what you should do next.
The key difference lies in depth and speed. Traditional analytics delivers static reports days after events occur. BI provides real-time visibility into operations, customer behavior, and market trends. When your supply chain faces disruption or sales patterns shift unexpectedly, BI surfaces those signals immediately.
“BI architecture typically includes data collection from operational systems, data integration via ETL, data storage in warehouses, data processing with analysis tools, and data presentation through reports and visualizations.”
For executives, this means moving from gut-feel decisions to evidence-based strategy. You gain the ability to:
- Identify revenue opportunities before competitors notice them
- Spot operational inefficiencies draining resources
- Predict customer churn and take preventive action
- Allocate budgets based on actual performance data
BI isn’t just about having more data. It’s about having the right insights at the right moment. When data analytics and decision intelligence work together, you transform information overload into competitive advantage.
The building blocks: How business intelligence works
Understanding BI system architecture helps you evaluate solutions and avoid costly implementation mistakes. Every reliable BI platform rests on five interconnected pillars.

1. Data collection pulls information from your operational systems. This includes ERP platforms, CRM databases, financial software, and external sources like market feeds. The challenge isn’t gathering data but ensuring quality and consistency across sources.
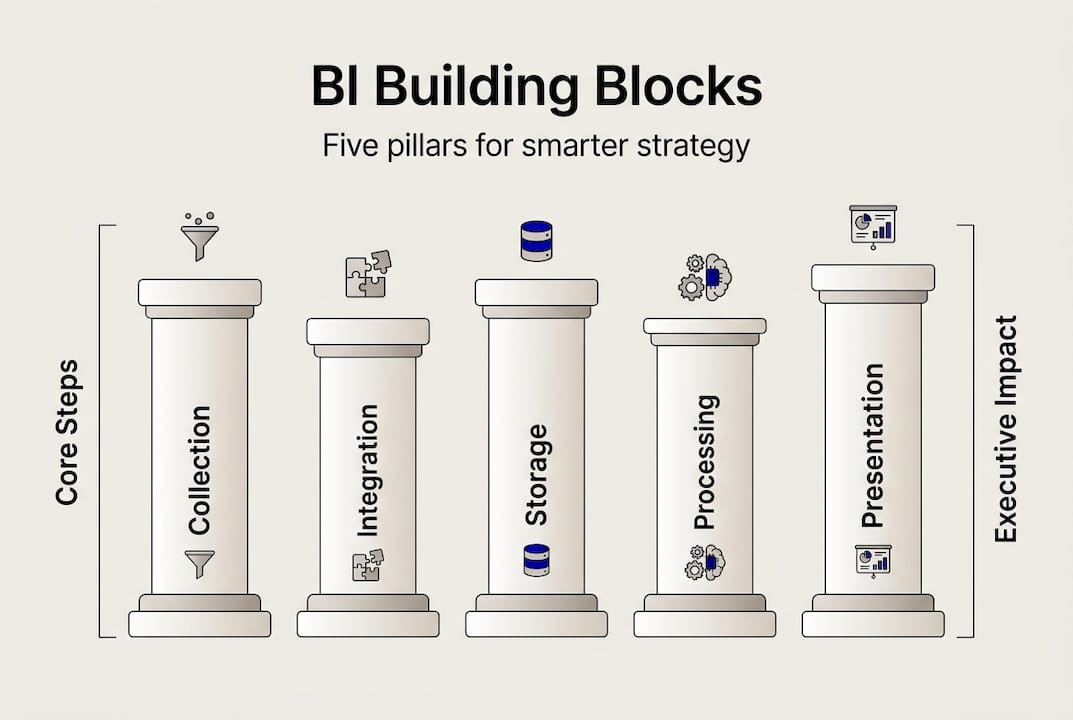
2. Data integration uses ETL processes to extract, transform, and load information into a unified format. Raw data from different systems rarely matches perfectly. Integration cleanses inconsistencies, standardizes formats, and prepares information for analysis.
3. Data storage houses processed information in warehouses or data marts. Think of warehouses as centralized repositories holding enterprise-wide data, while marts serve specific departments like sales or finance. Storage architecture directly impacts query speed and scalability.
4. Data processing applies analytical tools to uncover patterns, trends, and anomalies. This layer handles calculations, statistical analysis, and predictive modeling. Processing power determines how quickly you can answer complex business questions.
5. Data presentation delivers insights through dashboards, reports, and visualizations. This is what executives actually see and interact with daily. Effective presentation makes complex data immediately understandable.
| Component | Executive Impact | Common Tools |
|---|---|---|
| Collection | Data quality and completeness | API connectors, database links |
| Integration | Unified view across systems | ETL platforms, data pipelines |
| Storage | Query performance and scale | Cloud warehouses, on-premise marts |
| Processing | Speed of insight generation | Analytics engines, ML models |
| Presentation | Decision-making clarity | Dashboards, mobile apps |
Pro Tip: Start with a single, high-impact use case rather than trying to integrate every data source at once. Prove value quickly, then expand systematically.
The most common pitfall is underestimating data quality issues. Garbage in means garbage out, regardless of how sophisticated your analytics are. Invest time upfront in data governance and validation rules.
Another frequent mistake is choosing storage solutions that can’t scale with growth. What works for 10 users analyzing monthly reports fails when 100 users need real-time dashboards. Plan for tomorrow’s needs, not just today’s.
When these five pillars work together seamlessly, you create a foundation for executive analytics tools that actually get used. The difference between dashboards vs traditional reports becomes clear when you experience instant insights versus waiting for monthly summaries. Modern data analytics visualization transforms numbers into stories that drive action.
Modern features of business intelligence platforms
Today’s BI platforms go far beyond legacy reporting tools. Modern BI platforms support use cases like metrics creation through semantic layers, composable analytics with embedded BI and APIs, augmented analytics using GenAI for natural language queries, and governed self-service with content management guardrails.
Self-service BI empowers business users to create their own reports without IT intervention. Semantic layers translate technical database structures into business-friendly terms. Instead of writing SQL queries, your sales director asks “Which products drove Q1 growth?” and gets instant answers. Governance ensures users can’t accidentally access sensitive data or create misleading reports.
Composable analytics treats BI as building blocks you can embed anywhere. APIs let you surface insights directly in operational applications. Your field technicians see equipment performance data in their mobile app without switching to a separate BI tool. Embedded analytics brings intelligence to the point of decision.
Augmented analytics leverages AI to automate analysis and surface insights you might miss. Natural language processing lets executives ask questions conversationally. Machine learning identifies patterns and anomalies automatically. Instead of spending hours exploring data, AI highlights what matters most.
| Feature Category | Traditional BI | Modern BI |
|---|---|---|
| User Access | IT-dependent reports | Self-service exploration |
| Deployment | Standalone tools | Embedded everywhere |
| Query Method | Manual analysis | Natural language AI |
| Insight Discovery | Human-driven | AI-augmented |
| Governance | Restrictive locks | Intelligent guardrails |
Pro Tip: When evaluating platforms, test natural language capabilities with your actual business questions. Generic demos look impressive but may fail with your specific terminology and metrics.
The shift to AI-driven analytics represents the biggest change in BI since dashboards replaced printed reports. GenAI doesn’t just answer questions faster. It suggests questions you should be asking based on data patterns and business context.
For organizations in KSA, UAE, and Egypt, these capabilities matter even more. Regional markets move quickly, and competitive advantages disappear fast. The ability to spot opportunities and threats in real-time separates market leaders from followers.
Automating reporting frees your team from manual data compilation. They spend time on strategy instead of spreadsheet updates. When combined with AI consulting for SMEs approaches, even mid-sized organizations access enterprise-grade intelligence capabilities.
Practical benefits: BI in executive decision-making
Theory matters less than results. Here’s how BI drives tangible outcomes for leaders across sectors and regions.
Supply chain optimization becomes possible when you see inventory levels, supplier performance, and demand forecasts in one view. A construction materials distributor in Jeddah reduced stockouts by 40% after implementing BI that connected warehouse systems with sales patterns and weather forecasts. Real-time visibility prevented both shortages and excess inventory.
Sales performance management transforms from monthly reviews to daily optimization. A telecom provider in Dubai used BI to identify which customer segments responded best to specific offers. Sales teams focused efforts on high-probability opportunities, increasing conversion rates by 28% while reducing marketing spend.
Risk management improves when you spot warning signals early. A regional bank in Cairo implemented BI that monitored transaction patterns and customer behavior. The system flagged potential fraud cases 60% faster than manual review processes, preventing significant losses.
“Modern BI platforms support use cases like metrics creation, composable analytics, augmented analytics, and governed self-service with content management and guardrails.”
These aren’t isolated success stories. They represent systematic approaches to leveraging data for competitive advantage. The pattern is consistent:
- Identify a specific business challenge with measurable impact
- Connect relevant data sources that inform that challenge
- Build dashboards that surface actionable insights
- Empower decision-makers with real-time visibility
- Measure results and refine continuously
Operational applications focus on efficiency and cost reduction. Strategic applications drive revenue growth and market positioning. The best BI implementations deliver both simultaneously.
When BI and ERP integration works properly, financial data flows seamlessly into operational dashboards. You see how procurement decisions impact cash flow in real-time. Improving operational performance becomes a continuous process rather than periodic initiative.
For executives managing multi-country operations across the Middle East and North Africa, BI provides the unified visibility needed to balance local autonomy with regional coordination. You spot best practices in one market and replicate them elsewhere. You identify underperforming locations before problems escalate.
Evaluating and choosing the right BI solution
Selecting the right platform requires a structured approach. Here’s a framework that separates must-have capabilities from nice-to-have features.
1. Define your core business questions first. Don’t start with technology. List the top 10 decisions you make regularly and the information needed to make them confidently. If you can’t articulate specific questions, you’re not ready to evaluate platforms.
2. Assess integration capabilities thoroughly. The platform must connect to your existing systems without requiring complete infrastructure overhaul. Test integration with your actual data sources during evaluation, not just vendor demos with sample data.
3. Evaluate user experience rigorously. If your team finds the platform confusing, they won’t use it regardless of capabilities. Involve actual end users in testing, not just IT staff who think differently about data.
4. Verify scalability and performance. Today’s 50 users become tomorrow’s 500. Today’s monthly reports become tomorrow’s real-time dashboards. Ensure the platform handles growth without degrading performance or requiring expensive upgrades.
5. Examine security and governance features. Modern BI platforms support governed self-service, but implementation varies widely. You need granular access controls, audit trails, and data lineage tracking, especially in regulated industries like banking and healthcare.
6. Consider regional requirements carefully. Organizations in KSA, UAE, and Egypt face specific challenges around data residency, Arabic language support, and local compliance requirements. Verify the vendor understands these needs rather than offering generic global solutions.
7. Plan for change management proactively. Technology is the easy part. Getting people to change how they work is hard. Budget time and resources for training, communication, and ongoing support.
Pro Tip: Run a 90-day pilot with a single department before enterprise rollout. Real-world usage reveals issues that never surface in vendor demos or proof-of-concept projects.
Implementation challenges typically fall into three categories. Technical issues involve data quality, integration complexity, and performance tuning. Organizational issues include resistance to change, competing priorities, and unclear ownership. Strategic issues emerge when BI initiatives lack executive sponsorship or clear business objectives.
The most successful implementations treat BI as a business transformation initiative, not an IT project. Executive sponsors actively use the platform and hold teams accountable for data-driven decisions. Success metrics focus on business outcomes like revenue growth or cost reduction, not technical metrics like system uptime.
When you’re ready to move from evaluation to action, analytics for strategic business provides frameworks for aligning BI investments with corporate strategy. The goal isn’t implementing technology. It’s building organizational capabilities that compound over time.
Explore BI-driven digital transformation with expert partners
For executives and teams aiming to accelerate BI adoption, tailored tools and expert partnerships make the difference between successful transformation and expensive false starts.
The journey from data chaos to strategic clarity requires more than software licenses. It demands deep understanding of both technology capabilities and business realities. Organizations across KSA, UAE, and Egypt face unique challenges around legacy system integration, regulatory compliance, and rapid market evolution.
Singleclic brings 10+ years of regional digital delivery experience to BI implementations. Our approach combines world-class platforms like Microsoft Dynamics 365 and Odoo with custom solutions built on our Cortex low-code platform. We’ve helped 60+ enterprise clients including Emirates Health Services, QNB, and Emaar Misr transform data into competitive advantage.
Whether you need business process automation that feeds clean data into BI systems or a complete digital transformation roadmap that positions BI as a strategic enabler, we deliver solutions that work in real-world conditions. Our 70+ consultants and engineers across the region understand local requirements while bringing global best practices.
The difference between digitalization and optimization lies in execution. We help you move beyond collecting data to actually using it for faster, smarter decisions that drive measurable business results.
Frequently asked questions
How is business intelligence different from standard reporting?
Business intelligence connects data from many sources, delivers real-time insights, and supports strategic decisions beyond static reports. Standard reporting shows historical performance while BI reveals patterns and predicts future outcomes.
Which BI features matter most for executives?
Self-service analytics, integration abilities, augmented insights, and robust data governance lead BI priorities for leaders. These capabilities enable faster decisions without creating data chaos or security risks.
What is augmented analytics in BI?
Augmented analytics uses AI to automate analysis and enable executives to ask questions in natural language. Machine learning surfaces insights automatically rather than requiring manual exploration of data.
How does BI support digital transformation?
BI acts as the backbone for data-driven transformation by unifying information and empowering smarter, faster decisions. It connects isolated systems into coherent intelligence that guides strategic initiatives.
What’s the first step in adopting a BI system?
Start by identifying your core business questions and selecting a platform that supports data integration and ease of use. Prove value with a focused pilot before expanding to enterprise-wide deployment.
Recommended
- How Analytics Guide Strategic Business Moves | Singleclic
- Data Analytics and Decision Intelligence — The Power Behind Smarter Business Decisions | Singleclic
- Executive Analytics Tools for Smarter Management | Singleclic
- Integrating BI with ERP Systems: Unlocking Powerful Business Insights | Singleclic
- Beyond the Bag: Why “Data-Driven Roasting” is Your Cafe’s Best Friend – https://trade.thecoffeefactory.co.uk