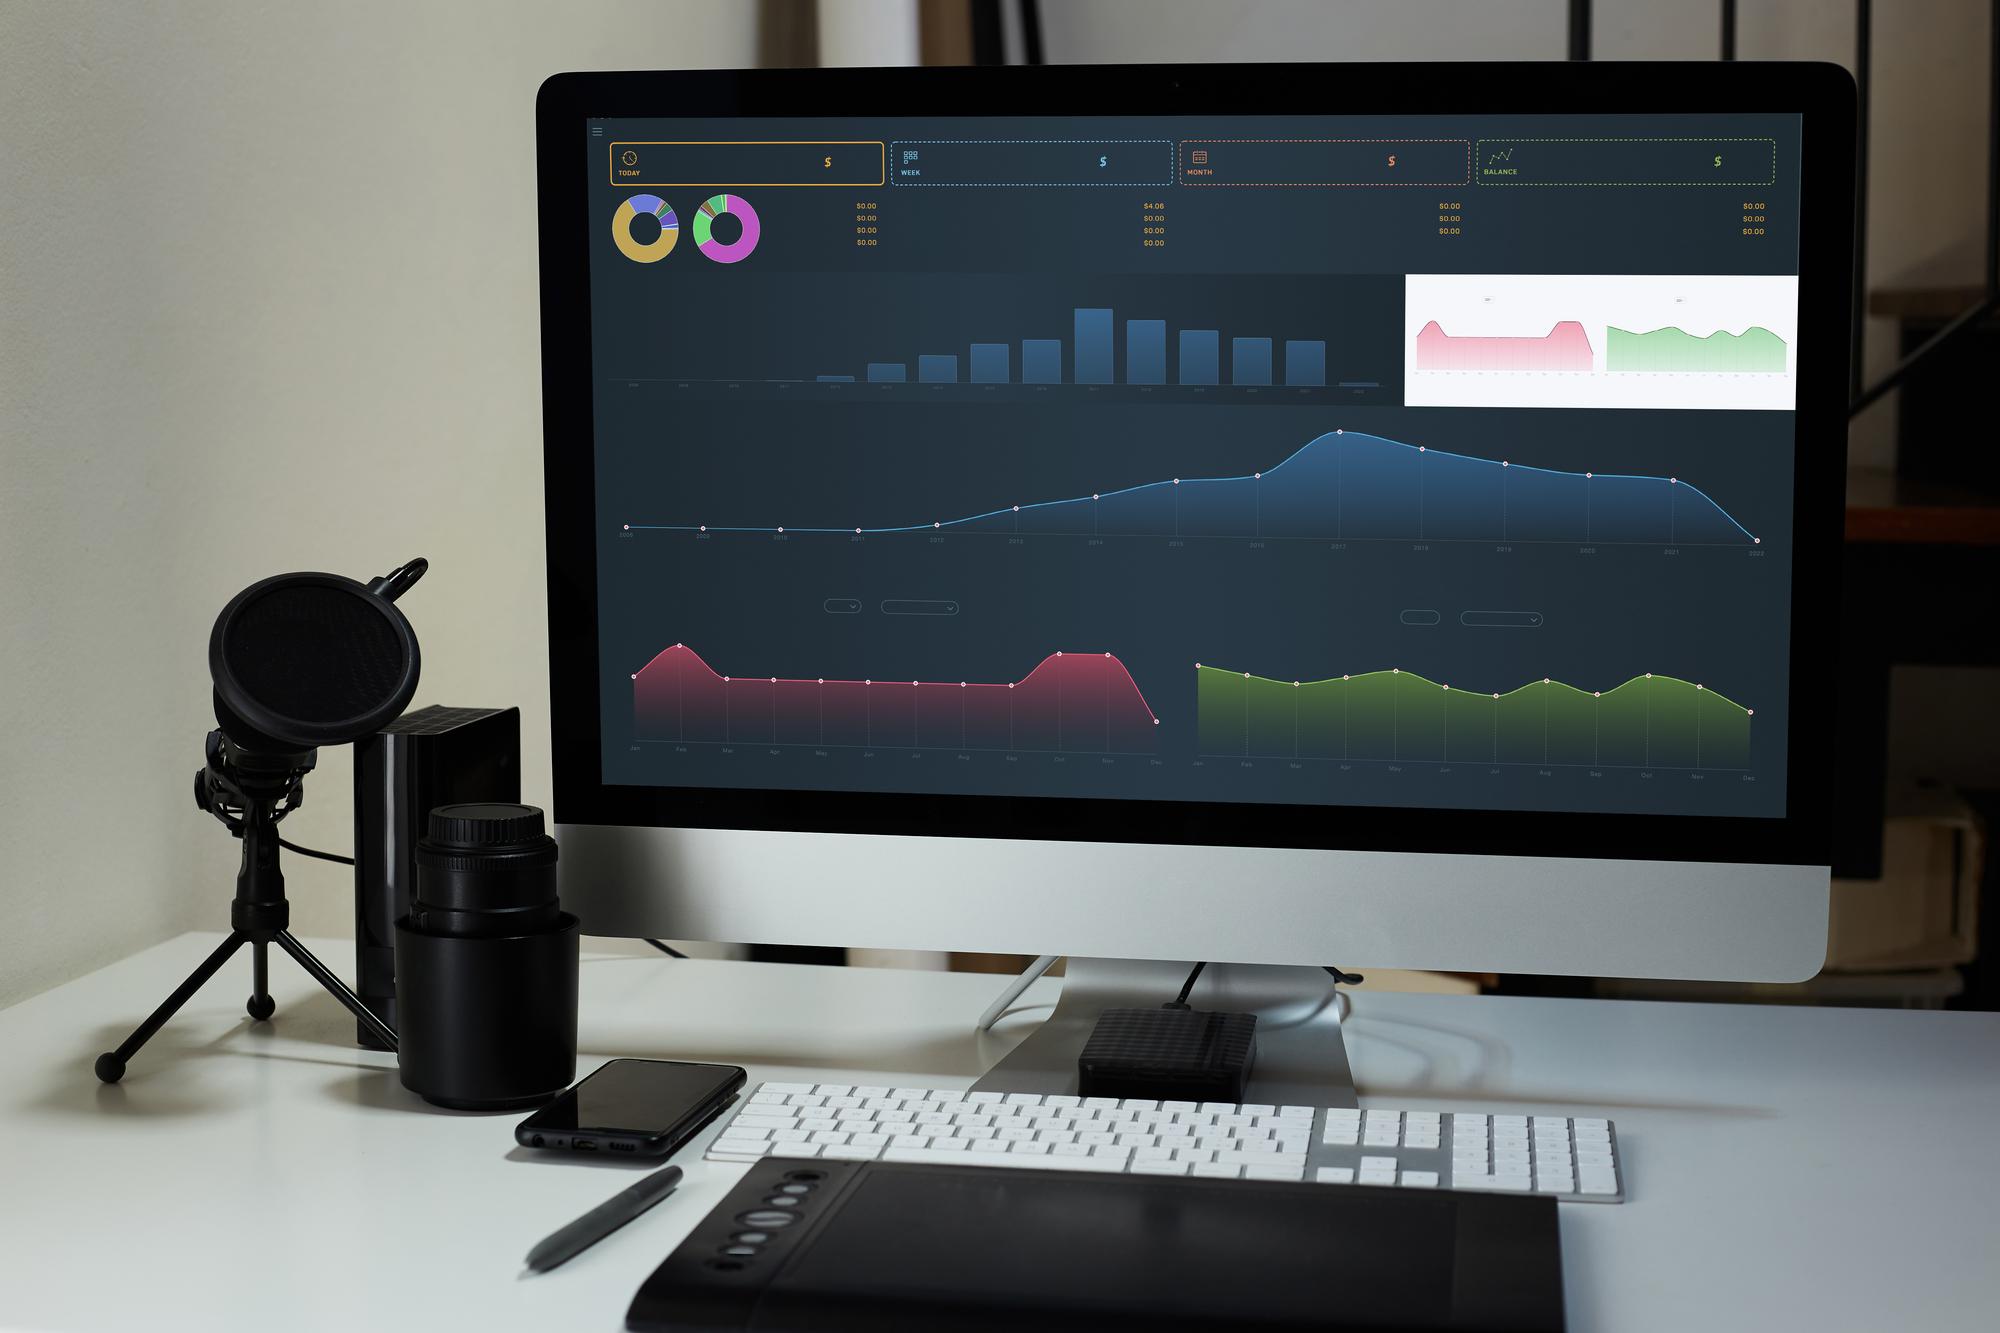
Effective Dynamics 365 performance tuning starts with diagnosis, not hardware. Baseline current behavior, pull telemetry from Performance Insights, Trace Parser, and Query Store, then fix the cheapest, highest-impact problem first. Change one variable at a time, measure the delta, and document it. Skip the baseline and you’re guessing, not tuning.
TL;DR:
- Custom plugins running synchronously on every save, heavy forms with many fields, and unfiltered views with missing indexes are the most common and impactful bottlenecks to address first.
- Accurate diagnosis requires capturing real baseline metrics, including client and server request times, query durations, and error rates, using tools like Performance Insights, Trace Parser, and Query Store.
- Low-cost, high-impact fixes such as trimming forms, consolidating JavaScript, and scheduling heavy batch jobs outside business hours provide quick wins before tackling more complex issues.
- Regular re-baselining after updates and ongoing monitoring of asynchronous workflows prevent performance regressions caused by data growth, code changes, or platform updates.
- A structured, lifecycle approach to performance management, including discovery, prioritized fixes, and continuous monitoring, is essential for maintaining optimal Dynamics 365 performance over time.
Table of Contents
- Why Dynamics 365 performance matters and who owns what
- Common bottlenecks and root causes to check first
- How do you diagnose a Dynamics 365 performance problem?
- Prioritized tuning checklist: what to fix, in what order
- F&O vs. Customer Engagement: where the tuning differs
- How Singleclic approaches Dynamics 365 performance tuning
- Monitoring and tuning asynchronous processes and workflows
- Upgrade and patch impact on performance and tuning adjustments
- Database optimization beyond indexing
- Infrastructure factors: network latency and server resources
- Using Azure tools to monitor and scale Dynamics 365
- Practitioner perspective: treat tuning as a maintenance habit, not a project
- How Singleclic helps you fix Dynamics 365 performance for good
- Sources
- FAQ
Why Dynamics 365 performance matters and who owns what
Slow forms and stalled batch jobs are not merely cosmetic problems. They erode adoption, push users back to spreadsheets and shadow processes, and quietly inflate the cost of every transaction that touches the system. A sales rep who waits a noticeable delay for a form to load will avoid updating records unless forced to, and a finance team running month-end close against a sluggish batch queue burns overtime hours that never show up on a performance dashboard, but show up on payroll.
Dynamics 365 is Software as a Service, which changes the conversation. Microsoft advises that performance tuning requires defining nonfunctional performance requirements early and validating them with realistic testing that mirrors actual user load, not a lab scenario. Moving to the cloud does not remove that responsibility from the customer or the implementation partner. It just moves the boundary lines.
Responsibility typically splits three ways:
- Customer: business process design, data volume management, user training, and realistic acceptance testing before go-live.
- Implementation partner: solution architecture, custom code quality, indexing strategy, and integration design.
- Microsoft: underlying infrastructure, platform patching, core service availability, and capacity of the shared environment tiers.
Nobody in that chain can tune a system they don’t understand end to end, which is exactly why the diagnostic phase below comes before any fix.
Common bottlenecks and root causes to check first
Most Dynamics 365 performance complaints trace back to a short list of repeat offenders. Work through these in order before you start rewriting anything.
- Custom plugins running synchronously. A plugin firing on every record save, doing a callout or a heavy query in the main execution pipeline, will slow down every user touching that entity, even when the logic itself is simple.
- Heavy forms with too many field loads. Forms that pull dozens of fields, multiple subgrids, and several business rules on load feel sluggish even on fast networks, because the browser has to render and script all of it before the user can act.
- Multiple JavaScript libraries fighting each other. Stacked, uncombined scripts multiply load time and create timing bugs that are hard to reproduce and harder to explain to a frustrated user.
- Wide, unfiltered views and missing indexes. A view scanning an entire entity without a usable filter or a matching index forces a full table scan every time someone opens it.
- Integrations competing with interactive users. Nightly imports that spill into business hours, or real-time integrations hitting the same tables users are working in, create contention that looks like random slowness.
- Heavy batch jobs scheduled at the wrong time. Batch jobs sized for a fraction of current data volume will eventually saturate a batch server, especially post-growth.
- Data growth and oversized attachments in Dataverse. Years of unarchived records and large file attachments inflate storage and slow down queries that were never designed for that volume.
Practitioner guidance consistently points to the same short list. Most Dynamics 365 performance problems trace to a small set of recurring causes, and fixing those first delivers the fastest return before you touch anything more exotic like server sizing or network topology.
How do you diagnose a Dynamics 365 performance problem?
You diagnose it by capturing a real baseline, then narrowing down where time is actually being spent, using the tools Microsoft ships for exactly this purpose. Guessing which layer is slow, and jumping straight to a fix, is the single most common mistake teams make.
Start with baseline metrics before touching anything:
- Client-side page load time for the top five or ten most-used forms and views.
- Server-side request duration for those same operations.
- Query execution time for the underlying database calls.
- Error and timeout rates over a representative week, not a single good or bad day.
Performance Insights, available in the Power Platform admin center, surfaces client-side timing data per app and per user, which is often the fastest way to spot a form that’s slow for everyone versus one that’s slow only for users on a poor connection. Pair it with Monitor for broader telemetry across the environment.
For server-side execution, Trace Parser reads X++ trace files and shows exactly where time goes inside a Finance & Operations transaction, down to the individual method call. Plugin trace logs do the equivalent job on the Customer Engagement side, exposing which plugin step is eating milliseconds. Query Store, sitting closer to the database layer, tracks query execution plans over time and flags regressions when a plan suddenly gets worse after a data change or an index drop.
Pro Tip: Always test in a Tier-2 or higher environment. Tier-1 sandbox environments are too small and too shared to produce numbers you can trust, and a fix that looks great on Tier-1 can fall apart under real concurrency.
Run tests with realistic user roles and realistic concurrency, not a single admin account clicking through a happy path. A test that doesn’t replicate actual traffic patterns will miss the exact contention that’s causing the complaint.
Prioritized tuning checklist: what to fix, in what order
Once diagnostics point to a cause, work through fixes in order of cost versus impact. Cheap, low-risk wins go first.
- Trim forms and reduce fields on the main tab. Move secondary fields to additional tabs, remove unused subgrids, and question every business rule that fires on load. This alone often cuts perceived load time noticeably with zero code risk.
- Combine and minify JavaScript libraries. Fewer script files mean fewer round trips and less parsing overhead. Enforce browser caching headers so returning users aren’t re-downloading the same assets every session.
- Prefer native platform features over custom plugins. Business rules, Power Automate flows, and calculated fields usually outperform hand-written plugin code for the same logic, and they’re easier for the next administrator to maintain.
- Move non-critical plugin logic to asynchronous processing. If a plugin doesn’t need to block the save operation, it shouldn’t. Add depth checks to prevent recursive triggering, and add telemetry so you can see execution time in production, not just in a sandbox.
- Add filters and indexes to slow queries and views. Avoid wildcard searches at the start of a string field, since those defeat most indexes outright. Rework the view’s default filter before assuming the entity itself is the problem.
- Archive large attachments and old records. A retention policy that moves closed records and stale attachments out of the primary working set keeps queries fast without deleting anything a compliance team needs later.
- Reschedule heavy batch jobs and integrations. Move bulk imports and reporting extracts outside business hours, and switch to set-based data operations wherever the integration currently processes records one at a time.
- Verify every change in isolation. Make one change, measure the before and after numbers on the same baseline metrics, and write down what you changed and what moved. Documenting each change and testing customizations one at a time is the difference between a tuning project that compounds and one that just shuffles the same problem to a different screen.
Pro Tip: Keep a simple smoke test, even a manual one, that checks response time on your three or four most critical user journeys after every change. It catches the regression you didn’t expect, before your users report it for you.
F&O vs. Customer Engagement: where the tuning differs
Finance & Operations and Customer Engagement share a platform family but not a tuning playbook. Treating them identically wastes effort.
In F&O, the Optimization advisor scans configuration and data for known issues and generates concrete cleanup opportunities, which makes it a reasonable first stop before deeper tracing. Query Store watches execution plans at the database layer, batch server capacity needs regular review as transaction volume grows, and set-based data entities beat record-by-record integration for any bulk load. The Data Management Framework’s migration tooling also matters here, since a poorly staged data migration can leave behind statistics and indexes sized for the wrong volume.
In Dataverse and Customer Engagement, the priorities shift toward the client experience:
- Form trimming and JavaScript consolidation, since most user-facing complaints originate in the browser, not the database.
- Plugin trace logs for anything running server-side on create, update, or delete.
- Power Platform Performance Insights for ongoing, app-level client timing across your user base.
- Storage and attachment strategy, since Dataverse capacity and large file handling behave differently than a traditional SQL database.
Both products enforce priority-based throttling to protect the shared service. Service Protection API Limits will throttle high-throughput operations regardless of how well-tuned your code is, so schedule heavy jobs outside peak hours rather than fighting the limit.
How Singleclic approaches Dynamics 365 performance tuning
Singleclic runs performance work as a lifecycle, not a one-time fix: requirements and baseline capture, performance-aware solution design, instrumentation of custom code, prioritized tuning sprints, then ongoing monitoring. That sequence mirrors Microsoft’s own implementation guidance on designing for performance rather than patching it in afterward.
Singleclic has run this pattern for enterprise clients including Emirates Health Services, Dubai Healthcare City, and QNB.
A typical engagement includes:
- A discovery workshop mapping the slowest workflows and the users who feel the most pain.
- A prioritized fix list ranked by effort versus impact, not just technical severity.
- Quick wins implemented and measured within the first sprint, before the bigger structural fixes begin.
- A monitoring plan so the next slowdown gets caught before it becomes a help desk ticket.
That last point matters more than it sounds. A one-time tuning pass without a monitoring plan behind it degrades again within a year, once data volume and user count creep back up.
Monitoring and tuning asynchronous processes and workflows
Asynchronous plugins, Power Automate flows, and background workflows fail quietly. Nobody notices a queue backing up until a batch of approvals is three hours late and someone’s finance close is stuck.
Start by checking the async processing service’s queue depth and execution time trends, not just whether jobs eventually complete. A workflow that used to finish in ten seconds and now takes ninety is a leading indicator of a problem that hasn’t caused a visible outage yet, but will.
Common failure patterns worth watching for:
- Recursive triggering. A workflow that updates a field, which triggers another workflow, which updates a related field, can spiral into hundreds of unnecessary executions per transaction.
- Unbounded retry loops. A failing integration step that retries indefinitely without backoff will keep consuming async capacity that other, healthy workflows need.
- Sequential processing where parallel would work. Some background jobs process records one at a time when the underlying operation could be batched, wasting the async infrastructure’s capacity.
Set alerting thresholds on queue depth and average execution time, not just on outright failures. A queue that’s growing steadily, even without errors, is telling you something a simple pass or fail check will miss. Review these dashboards on the same cadence as your other performance baselines, since async bottlenecks tend to surface weeks after a data volume increase, not the day it happens.
Upgrade and patch impact on performance and tuning adjustments
Every Dynamics 365 update carries a real chance of shifting performance, in either direction. Microsoft’s regular release cadence patches known issues, but it also changes query plans, default configuration values, and sometimes the behavior of features your tuning depended on.
Treat every major update as a mini re-baseline event. Run your standard set of baseline metrics, the same page loads, server durations, and query times you captured originally, against the updated environment before declaring it stable. A form that was fast last month can slow down after an update changes how a related entity’s index gets used, with no code change on your side at all.
Sandbox and pre-production environments earn their keep here. Apply the update there first, run your smoke tests and load tests, and compare the numbers against your documented baseline before the same update reaches production. This is also where Query Store proves its worth on the F&O side, since it flags execution plan regressions automatically after an update, rather than waiting for a user complaint to surface the issue.
Keep a short-form changelog of what each update touched and what moved in your metrics afterward. Six updates from now, that log is the fastest way to answer the question “did this start after the last patch?” instead of re-deriving it from scratch under pressure.
Database optimization beyond indexing
Indexing gets most of the attention, but it isn’t the only database lever available, and leaning on it alone eventually hits diminishing returns.
Statistics updates matter more than most teams assume. The database’s query optimizer relies on statistics about data distribution to pick an execution plan, and stale statistics after a large data load or bulk delete can push it toward a plan that made sense for last year’s data volume but not this year’s. Scheduling regular statistics updates, especially after bulk operations, keeps the optimizer working with current information.
Partitioning helps once tables grow large enough that even a well-indexed query has to scan through years of irrelevant history to find current records. Splitting a large transactional table by date range, for instance, lets the database skip entire partitions it knows can’t contain the requested rows.

Query plan review through Query Store catches regressions that indexing alone won’t prevent, since a perfectly good index can still get ignored by a plan that changed after an update or a data shift.
None of these replace good indexing. They work alongside it, and they matter most once an environment has been running long enough that data volume, not query design, becomes the dominant factor in response time.
Infrastructure factors: network latency and server resources
A beautifully tuned application layer still feels slow if the network path between the user and the service is bad. This is the part of the shared responsibility model that most often gets overlooked, because it sits outside the application entirely.
Network latency between a user’s location and the Dynamics 365 datacenter region adds up, especially for users connecting from a branch office over a congested VPN or a satellite link. Before blaming the platform, check basic round-trip time to the service endpoint and compare it against Microsoft’s published regional guidance, since users in a region far from their assigned datacenter will always carry a latency floor that no amount of query tuning can remove.
Server resource monitoring matters most on the customer-managed side of hybrid or on-premises components, like a batch server for F&O or an integration middleware box. CPU, memory, and disk I/O on those boxes should be tracked continuously, not checked only when someone complains, since resource exhaustion tends to build gradually and then fail suddenly during a peak load event like month-end close.
Bandwidth also matters for anyone working with large attachments or heavy reporting exports. A user on a constrained connection downloading a large Excel export will experience that as “Dynamics is slow,” even though the platform itself responded quickly.
Using Azure tools to monitor and scale Dynamics 365
For environments with Azure-hosted integrations, custom APIs, or Power Platform extensions, Azure’s own monitoring stack extends what Performance Insights and Trace Parser already show you.
Azure Monitor and Application Insights track custom API and integration performance end to end, which matters because a slow custom connector or middleware layer can look, from inside Dynamics 365, exactly like a platform slowdown. Application Insights traces a request across service boundaries, so you can see whether the delay originated in Dynamics 365, in your Azure Function, or in a third-party API it’s calling.
Azure Service Bus and Logic Apps, when used for integration patterns, benefit from their own throughput and dead-letter queue monitoring, since a backed-up queue there produces the exact same symptom as an async workflow backlog inside Dynamics 365 itself: work that should have happened didn’t, and nobody noticed until it mattered.
For scaling, Azure’s autoscale rules on any customer-managed compute (batch servers, integration middleware, custom API hosts) should be tied to the same metrics you’re already tracking, queue depth, CPU, and response time, rather than a fixed schedule that assumes load is predictable. Load rarely is, especially around fiscal close periods or seasonal business spikes.
Practitioner perspective: treat tuning as a maintenance habit, not a project
Most teams tune once, after a crisis, and then stop. That’s backwards. Establish a baseline, review it lightly every quarter, and run a full audit annually, because data volume and user counts creep up faster than most IT teams notice.
The discipline that actually separates a stable environment from a chronically slow one isn’t clever code. It’s the boring habit of changing one thing at a time and keeping a change log, so six months from now you can trace a regression back to its cause in minutes instead of days.
If your internal team hits a wall, an external partner engagement usually makes sense the moment you’re guessing rather than measuring.
— Tamer Badr
How Singleclic helps you fix Dynamics 365 performance for good
A do-it-yourself audit gets you a diagnosis. Getting the fix implemented, verified, and monitored without pulling your internal team off their regular workload is where most in-house efforts stall out. Singleclic runs Dynamics 365 performance work as a fixed engagement, not an open-ended retainer: a discovery workshop, a prioritized fix list, implementation of the quick wins first, and a monitoring plan handed back to your team when it’s done.
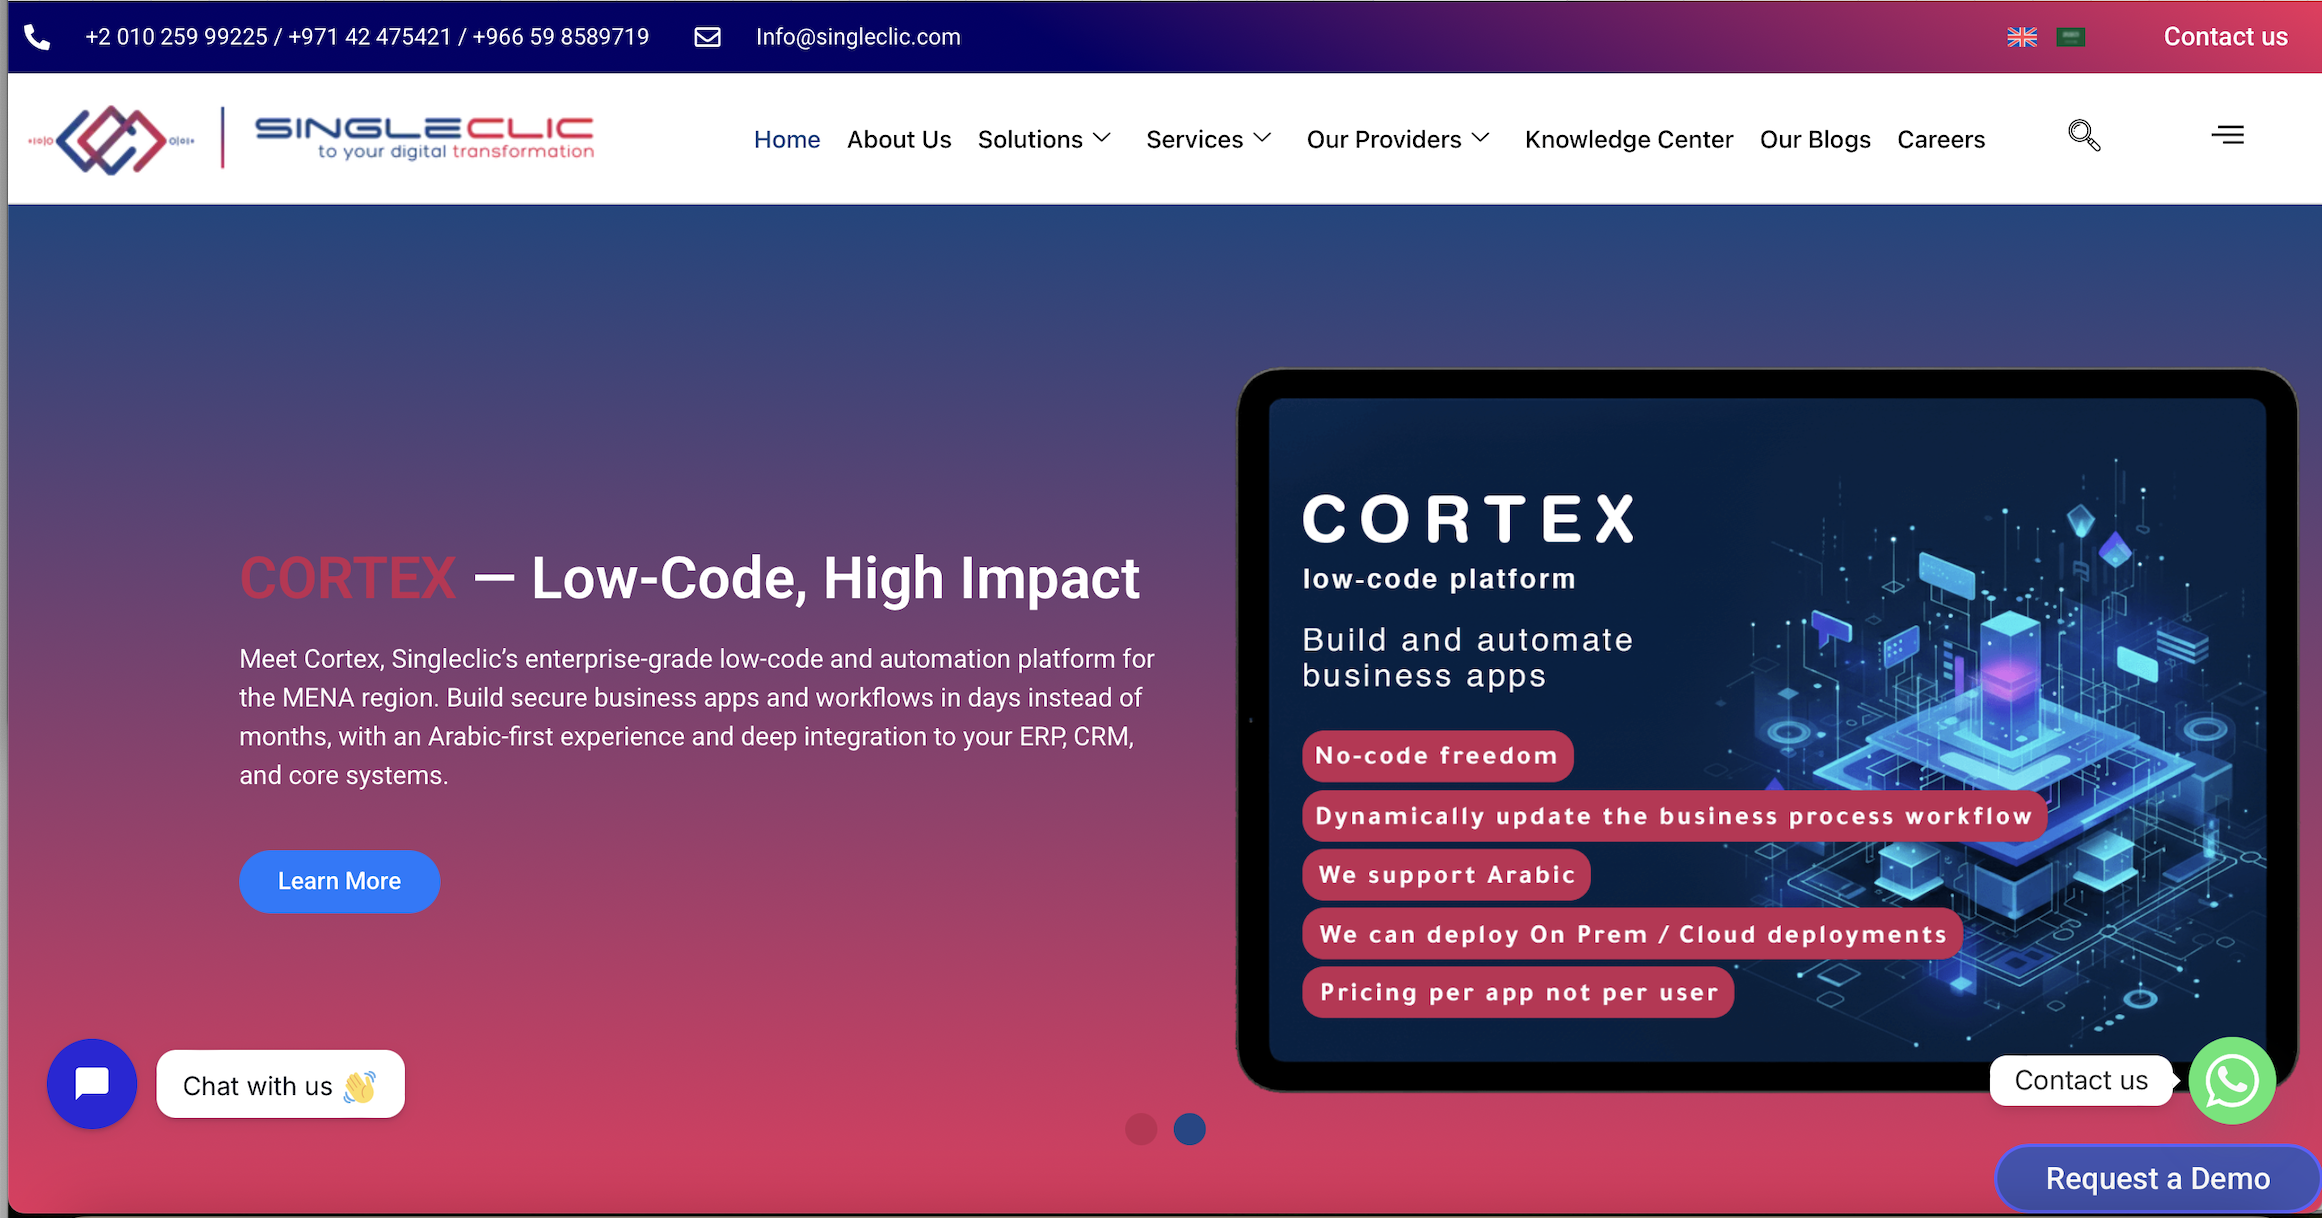
That engagement draws on the same regional delivery experience behind Singleclic’s Dynamics 365 implementation work across the UAE, and it extends naturally into Cortex, Singleclic’s Arabic-enabled, on-premise low-code platform, when the real bottleneck turns out to be a manual approval chain or a legacy integration rather than the Dynamics 365 configuration itself. If your team is chasing a slow batch job or a form nobody wants to open anymore, the fastest path forward is a conversation, not another internal ticket. Learn more about what Microsoft Dynamics 365 offers and book a performance workshop with Singleclic’s Dynamics 365 team to get a prioritized fix list in hand within your first session.
Sources
For teams who want to go straight to the primary documentation, start with Microsoft’s guidance on solution design for performance and its companion page on fixing performance issues in existing solutions. The Optimization advisor overview covers the F&O-specific diagnostic tool in detail, and Lifecycle Services remains the entry point for environment monitoring and Tier-2+ test environment management across both major product lines.
- Performing solution design for performance – Dynamics 365 | Microsoft Learn
- Optimize Microsoft Dynamics CRM: 12 Performance Tips
FAQ
What is the purpose of performance tuning?
Performance tuning finds and removes the bottlenecks that slow down real user work, cutting response times, reducing errors, and lowering the operational cost of running a system at scale.
How do you tune Dynamics 365 database performance?
Start with Query Store to catch execution plan regressions, keep statistics current after bulk data operations, add filters and indexes to slow queries, and use partitioning once tables grow large enough that date-range scans dominate response time.
What does performance tuning mean for Dataverse and CRM models?
For Customer Engagement and Dataverse, tuning centers on trimming forms, consolidating JavaScript, moving non-critical logic to asynchronous plugins, and archiving large attachments so queries aren’t scanning years of unneeded data.
How can I improve Dynamics 365 performance quickly?
Trim busy forms, combine JavaScript files, add missing indexes on frequently filtered views, and reschedule heavy batch jobs outside business hours. Each is low risk and measurable within a single sprint.
How often should Dynamics 365 be re-tuned after go-live?
Run a light review quarterly and a full audit annually, and treat any major platform update as a trigger to re-check your baseline metrics before assuming the environment is still stable.