TL;DR:
- Effective performance monitoring involves defining clear, strategic KPIs and establishing infrastructure for real-time data collection and visualization. Maintaining a structured review cycle and fostering a culture of transparency and continuous improvement are essential for lasting operational success. A small, focused set of metrics and regular assessments enable organizations to respond quickly and prevent crises.
Performance monitoring is defined as the systematic process of tracking key performance indicators (KPIs) aligned with an organization’s strategic goals to enable proactive decision-making and continuous operational improvement. For business leaders across Saudi Arabia, the UAE, and Egypt, getting this process right separates organizations that react to problems from those that prevent them. Real-time dashboards have changed the speed of response entirely. Organizations using real-time performance dashboards respond two to three times faster to issues compared to teams relying on manual methods. That gap in response time is the difference between a contained problem and an operational crisis. This guide walks you through performance monitoring step by step, from setting goals to sustaining a culture of continuous improvement.
How do you define clear goals and KPIs for performance monitoring?
The most common reason performance monitoring fails is not a lack of data. It is a lack of clarity about what the data should measure. Before you select a single metric, you need to define what success looks like for your organization.

Start by aligning your KPIs with your top strategic priorities. If your organization’s goal is to reduce customer churn in a competitive telecom market, your KPIs should trace directly back to customer satisfaction scores, resolution times, and contract renewal rates. If the priority is cost efficiency in a construction project, you track budget variance, material waste, and milestone completion rates. The KPI must answer a question that your leadership team actually cares about.
Apply the SMART criteria to every indicator you consider:
- Specific: The metric measures one defined outcome, not a vague concept like “performance.”
- Measurable: You can collect the data consistently and compare it over time.
- Achievable: The target is realistic given your current baseline.
- Relevant: The metric connects directly to a strategic goal.
- Time-bound: You review it on a fixed schedule, whether weekly, monthly, or quarterly.
Assign clear ownership for each KPI. Every metric needs one accountable person, not a committee. When no one owns a number, no one acts on it. Limit your initial KPI set to the metrics that will drive the most meaningful decisions. Starting with a small set of useful signals and a consistent review rhythm is more effective than scaling to enterprise-wide scorecards prematurely. That principle applies whether you are running a 50-person healthcare clinic in Jeddah or a 5,000-person government authority in Abu Dhabi.
Distinguish between leading and lagging indicators. Lagging indicators like quarterly revenue tell you what happened. Leading indicators like weekly sales pipeline value tell you what is about to happen. Separating signal from noise by focusing on metrics that align with strategy prevents the trap of tracking vanity metrics that look good in reports but drive no action.
Pro Tip: Cap your initial KPI dashboard at 8–12 metrics. If you cannot explain why each one matters in one sentence, cut it.
What tools and infrastructure do you need before you start?
Choosing tools before defining your success criteria is one of the most expensive mistakes a manager can make. A measurement-first workflow means defining your Service Level Indicators (SLIs), Service Level Objectives (SLOs), and performance budgets before selecting any platform or intervention. That sequence prevents wasted effort and what practitioners call “placebo optimizations,” changes that look productive but move no meaningful needle.
Once your criteria are defined, your infrastructure needs to support three capabilities: data collection, centralized storage, and real-time visualization. The table below maps tool categories to their primary strategic function.
| Tool category | Primary function | Strategic benefit |
|---|---|---|
| ERP platforms (e.g., Microsoft Dynamics 365) | Centralized operational data | Single source of truth across finance, supply chain, and HR |
| CRM systems | Customer interaction tracking | Links sales and service performance to revenue outcomes |
| BPM platforms (e.g., IBM BAW, Cortex) | Process workflow monitoring | Identifies bottlenecks and automates alerts within workflows |
| Real-time dashboard tools | Data visualization | Accelerates issue detection and stakeholder communication |
| Automated alerting systems | Threshold-based notifications | Triggers early warnings before issues escalate |
Baseline establishment is non-negotiable. You cannot set a meaningful alert threshold without knowing your normal operating range. Alert thresholds set slightly above target baselines provide early warnings before reaching critical failure points. Generic industry thresholds rarely fit your specific operational context. Customize them to your actual data.
Integration matters as much as the tools themselves. An ERP that does not talk to your CRM creates data silos that make cross-functional monitoring impossible. Singleclic’s Cortex platform connects approvals, ERP, CRM, legacy systems, and workflows in one environment, which removes the manual reconciliation that slows most monitoring cycles.
Pro Tip: Before going live with any monitoring tool, run a two-week parallel test where you collect data manually alongside the automated system. Discrepancies reveal integration gaps before they distort your reports.
What does the step-by-step performance monitoring process look like?
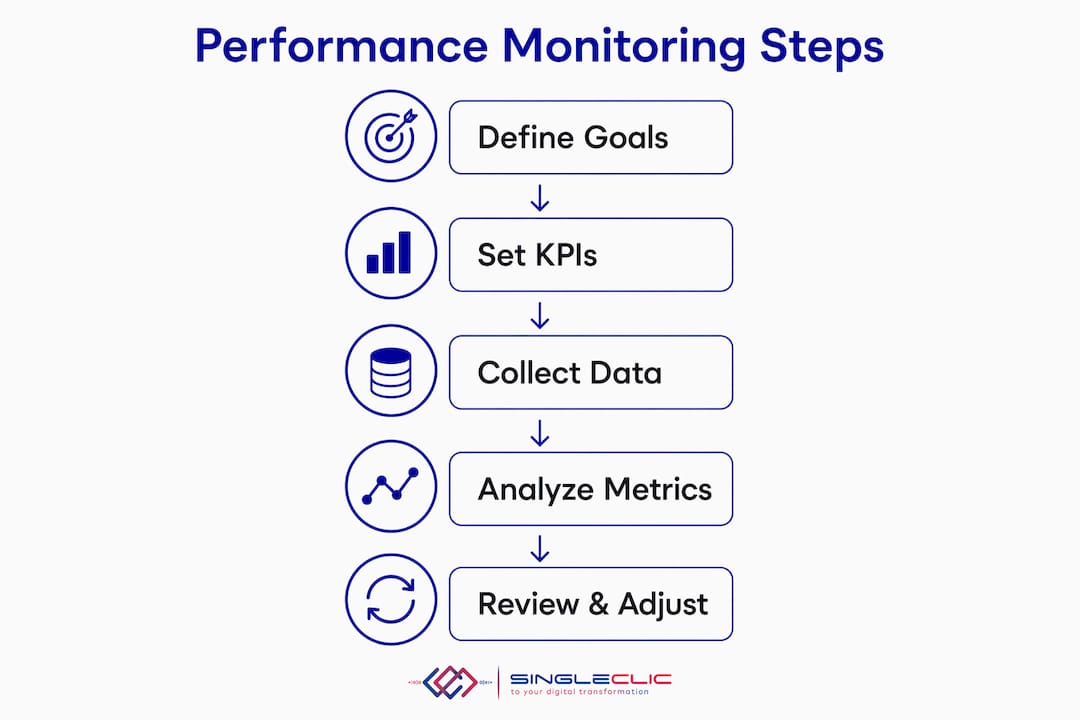
Effective performance monitoring is a cycle, not a one-time setup. The following steps define that cycle clearly.
-
Define your baseline. Collect at least four weeks of historical data before setting targets. Your baseline is the reference point that makes every future data point meaningful.
-
Configure your data collection. Connect your ERP, CRM, and BPM systems to a centralized dashboard. Automate data pulls wherever possible to eliminate manual entry errors.
-
Set alert thresholds. Program alerts to trigger when a metric moves outside your acceptable range. Alerts should fire early enough to allow intervention, not after the damage is done.
-
Run weekly operational reviews. Focus on metrics that change frequently: daily output, ticket resolution times, and cash flow. Keep these reviews short and structured. Frequent asynchronous check-ins and weekly reviews with focused formats prevent overly detailed or vague meetings.
-
Run monthly strategic reviews. Evaluate KPIs against monthly targets. Identify trends, not just snapshots. A single bad week matters less than three consecutive weeks of decline.
-
Run quarterly trend assessments. Effective monitoring cycles include weekly operational reviews, monthly strategic evaluations, and quarterly assessments of long-term trends. The quarterly review is where you decide whether your KPIs still reflect your current strategy.
-
Communicate findings to stakeholders. Build separate dashboard views for different audiences. Executives need summary-level trend data. Operations managers need granular daily metrics. Frontline teams need clear, simple indicators of their own performance.
-
Document and act. Every review cycle should produce at least one documented action item with an owner and a deadline. Data without action is just reporting.
Automated dashboards for business analysts reduce the time between data collection and decision by eliminating manual report preparation. That time saving compounds across every review cycle.
What are the most common challenges in performance monitoring implementation?
Most monitoring programs do not fail because of bad data. They fail because of how the data gets used, or ignored.
The first and most damaging mistake is tracking too many metrics. When every department adds its own KPIs to the central dashboard, the result is a report that no one reads. Performance monitoring efforts fail when too many metrics create bureaucratic overhead. The solution is a governance rule: any new KPI added to the dashboard requires removing one that is no longer driving decisions.
The second mistake is using monitoring as surveillance. Performance monitoring used as surveillance rather than a collaborative tool destroys team engagement and problem-solving. When employees believe their metrics are being used to catch them rather than help them, they game the numbers. Transparency about how data will be used, and who sees it, is the foundation of a monitoring culture that actually works.
Alert fatigue is the third common failure. When alert thresholds are set too low or too broadly, teams receive dozens of notifications per day. They start ignoring all of them. The fix is calibrating thresholds to your specific baseline, not to generic industry defaults.
Watch for these warning signs that your monitoring system needs recalibration:
- Review meetings consistently end without action items.
- The same metric has been “amber” for more than three consecutive months with no response.
- Teams report that the dashboard does not reflect their actual work.
- Alerts fire so frequently that they are being dismissed without investigation.
Proactive and continuous monitoring with automated alerts triggered before small issues escalate prevents the reactive cycle that consumes management time and erodes operational confidence.
How do you sustain performance monitoring for lasting operational improvement?
A monitoring system that runs for six months and then gets abandoned is worse than no system at all. It signals to your teams that measurement is a project, not a practice.
Quarterly resets are the mechanism that keeps your system relevant. At the end of each quarter, review whether your current KPIs still reflect your strategic priorities. Markets shift, regulations change, and organizational goals evolve. Your metrics must evolve with them. Document what you learned from the previous quarter’s data and use those learnings to sharpen your targets for the next.
Build a performance improvement playbook. Every time your monitoring data reveals a recurring problem, document the root cause, the intervention you used, and the outcome. Over time, this playbook becomes an institutional asset. New managers can resolve issues faster because the organization has already solved similar problems before.
Analytics and dashboards improve operational performance most when they are embedded in daily workflows rather than treated as a separate reporting function. The goal is for your team to check the dashboard the same way they check their email, not because they are required to, but because it gives them useful information.
Continuous monitoring also drives accountability without micromanagement. When every team member can see their own performance data in real time, the conversation shifts from “why did this happen” to “what are we doing about it.” That shift is the difference between a reactive organization and a high-performing one.
Pro Tip: Schedule a 90-minute “monitoring health check” at the end of each quarter. Review which alerts fired, which were acted on, and which were ignored. That audit tells you more about your monitoring culture than any dashboard.
Key Takeaways
Effective performance monitoring requires clear KPIs, the right infrastructure, a structured review cycle, and a culture that treats data as a tool for improvement rather than a mechanism for control.
| Point | Details |
|---|---|
| Define before you measure | Set SMART KPIs aligned to strategy before selecting any tool or platform. |
| Baseline first, thresholds second | Collect historical data to establish your normal range before configuring alerts. |
| Use a tiered review cadence | Run weekly operational, monthly strategic, and quarterly trend reviews consistently. |
| Limit your KPI count | Cap your dashboard at 8–12 metrics to prevent bureaucratic overhead and alert fatigue. |
| Make monitoring collaborative | Share data transparently with teams to build trust and drive problem-solving, not surveillance. |
What I have learned from performance monitoring in MENA organizations
After working with enterprises across Saudi Arabia, the UAE, and Egypt, I have noticed one pattern that separates the organizations that get real value from monitoring from those that do not. The successful ones treat their first dashboard as a hypothesis, not a finished product.
Most managers I work with initially want to track everything. They build dashboards with 40 metrics, color-coded by department, and feel a sense of control. Six months later, those dashboards are open in browser tabs that nobody clicks. The organizations that succeed start with five metrics, review them religiously every week, and add new ones only when they have a specific question that the current set cannot answer.
The cultural dimension matters more in this region than most Western frameworks acknowledge. In many MENA organizations, sharing performance data openly can feel threatening, particularly in hierarchical structures where a bad number reflects on the leader, not just the process. The managers who break through this barrier do so by modeling transparency themselves. They share their own team’s metrics first, including the ones that look bad, and they frame every review as a problem-solving session rather than a performance judgment.
I am also seeing a real shift toward low-code platforms like Cortex for building monitoring workflows. The ability to change a dashboard or an alert threshold at runtime, without waiting for an IT development cycle, means that monitoring systems stay current instead of becoming outdated artifacts. That agility is what turns a monitoring program into a living operational practice.
— Tamer Badr
How Singleclic supports your performance monitoring goals
Building a monitoring system that actually drives decisions requires more than a dashboard. It requires connected data, automated workflows, and a platform that adapts as your organization grows.
Singleclic implements Microsoft Dynamics 365 across ERP, CRM, and finance functions, giving your organization a single source of truth for all performance data. Cortex, Singleclic’s Arabic-enabled low-code platform, connects your approvals, workflows, and legacy systems so that monitoring data flows automatically to the right people at the right time. For organizations in Saudi Arabia, the UAE, and Egypt ready to move from reactive reporting to proactive performance management, Singleclic’s team of 70+ consultants and engineers delivers customized Dynamics 365 solutions built around your specific operational goals.
FAQ
What is performance monitoring in business?
Performance monitoring is the systematic tracking of KPIs aligned with organizational goals to enable proactive decision-making. It differs from standard reporting in that it is continuous, automated, and designed to trigger action before problems escalate.
How many KPIs should a business track?
Start with 8–12 KPIs. Tracking too many metrics creates overhead and reduces the likelihood that any single metric drives a decision. Add new KPIs only when a specific strategic question requires them.
How often should performance reviews happen?
Effective review cadences include weekly operational reviews, monthly strategic evaluations, and quarterly trend assessments. Each frequency serves a different decision-making horizon.
What is the difference between a leading and a lagging indicator?
A lagging indicator measures what already happened, such as quarterly revenue. A leading indicator predicts what is about to happen, such as weekly pipeline value. Effective monitoring uses both, but leading indicators give you more time to act.
Why do performance monitoring programs fail?
The most common causes are tracking too many metrics, using data as surveillance rather than a collaborative tool, and failing to act on monitoring insights. Monitoring systems that lack transparency and clear ownership consistently underperform those built on shared accountability.