Dynamics 365 sales forecasting turns the opportunities your sellers already log into a shared, near real-time view of expected revenue, rolled up from each seller to the CEO. It works well when three things are right: a forecast built on the right hierarchy, opportunities with complete data, and a team that reviews it every week. This guide shows how the feature works, how to configure it, and where forecasts go wrong, written for executives and IT leaders in the UAE and Saudi Arabia who own the outcome.
TL;DR
- Forecasting in Dynamics 365 Sales combines pipeline activity, forecast categories, quotas and hierarchy rollups into one view of expected revenue.
- Three templates exist: org chart, product and territory. Pick the one that matches how your leadership reviews targets.
- Configuration lives in App Settings, under Performance management, then Forecast configuration, and ends with activating the forecast.
- Premium predictive forecasting needs clean history: more than 10 closed opportunities with complete fields, plus estimated value and close date on open deals.
- Most “wrong” forecasts trace back to hierarchy gaps, category mismatches or stale recalculation, not to the software.
Table of Contents
- What forecasting does in Dynamics 365 Sales
- Forecast categories: where the numbers come from
- Default forecast versus configured forecast
- Choose the right template
- How to configure a forecast, step by step
- Periods and calendars
- Predictive forecasting
- Roles and permissions
- Reviewing, adjusting and sharing
- Troubleshooting a forecast that looks wrong
- Use cases for UAE and Saudi organizations
- How Singleclic helps
- Perspective
- Topic cluster
- FAQ
- Sources
What forecasting does in Dynamics 365 Sales
A sales forecast answers one question for leadership: how much revenue will we close in a given period, and are we on track against target? In Dynamics 365 Sales, the answer is built from live records. Sellers update opportunities, and those records roll up through a hierarchy to managers and executives.
According to Microsoft, the feature helps sellers see whether they are on track, helps managers spot risks early, and gives leadership current data for planning. The same page notes that forecasting is most effective when reviewed regularly and treated as a planning tool, not only a reporting artifact. Comparing committed revenue, best-case deals and the gap to target lets teams act earlier in the cycle.
For a CEO or CIO, the practical value is a single version of the number. Instead of regional managers sending spreadsheets, everyone reads the same forecast, drawn from the CRM.
Forecast categories: where the numbers come from
Every opportunity carries a forecast category. The category decides which column of the forecast the deal feeds. Microsoft defines these categories in its guide to capturing the forecast category:
| Category | Meaning | Confidence |
|---|---|---|
| Pipeline | Default. Early-stage or stalled deal | Low |
| Best Case | Deal is progressing | Medium |
| Committed | Customer has made a verbal or contractual commitment | High |
| Omitted | Excluded from all forecast totals | None |
| Won | Set automatically when closed as Won | Closed |
| Lost | Set automatically when closed as Lost | Closed |
This is where discipline matters. If sellers leave every deal at the default Pipeline category, the Committed column stays empty and the forecast says nothing useful. Agree internally on what qualifies a deal as Best Case or Committed, for example a signed purchase order or a confirmed verbal award, and write it down.
A worked example
Imagine a regional sales manager in Dubai with three deals. This is an illustration, not real data.
- Deal A, AED 400,000, customer has confirmed in writing: Committed.
- Deal B, AED 700,000, proposal under review: Best Case.
- Deal C, AED 1,000,000, no contact for six weeks: Pipeline.
The Committed column shows AED 400,000. Best Case adds AED 700,000. Deal C does not inflate either column. The manager sees that a AED 1,100,000 quarterly target is covered only if Deal B converts. That is a conversation to have this week, not at quarter end.
Default forecast versus configured forecast
If you configure nothing, sellers still see a default forecast. Per Microsoft, the out-of-the-box forecast covers the current month and cannot be customized, deleted or deactivated.
The View and manage a forecast page spells out the differences:
| Aspect | Out-of-the-box forecast | Configured forecast |
|---|---|---|
| Template | Org chart | Chosen by the administrator |
| Rollup entity | Opportunity | Defined by the administrator |
| Access | All users | Users granted access |
| Periods | Current month only | The number of periods you define |
| Refresh | Near real-time | Every 24 hours or manually |
| Record limit | Up to 50,000 | No limit |
For an enterprise with several business units, multiple currencies or a quarterly planning rhythm, the configured forecast is the one to build.
Choose the right template
Microsoft offers three templates, and you can also create a forecast from scratch.
- Org chart forecast follows reporting lines, using the Manager field on the user record. It suits teams where each manager owns a clear number.
- Product forecast follows the product hierarchy. It suits companies that plan revenue by product line, such as a healthcare supplier or a telecom services group.
- Territory forecast follows the sales territory hierarchy. It suits organizations that split the market by emirate, city or country, for example UAE and Saudi Arabia run as separate territories.
The choice is a leadership decision before it is a technical one. Ask how your CEO or sales director reviews performance today: by person, by product or by region. Build the forecast to match, or the quarterly meeting will still happen in a spreadsheet.
How to configure a forecast, step by step
The path in the Sales Hub app is App Settings, then Performance management, then Forecast configuration. The configuration guide lists the stages. Here is each one with what it takes and where it goes wrong.
- Open Forecast configuration and select a template. Choose org chart, product or territory, or start from scratch. Where it goes wrong: picking the template that is easiest to set up rather than the one leadership reads.
- Complete the General step. Define the rollup entity (usually Opportunity), the hierarchy entity (usually User), the relationship between them, the top of the hierarchy and the forecast periods. Only entities with Change Tracking turned on can be a rollup entity, and only hierarchy-enabled entities can serve as the hierarchy entity. The same page notes support for up to two levels of relationships between them, such as Opportunity to Owner to Territory. Where it goes wrong: a user missing a manager value drops out of the hierarchy and their deals vanish from the rollup.
- Grant access. Decide who can view the forecast. Where it goes wrong: building a forecast nobody can open.
- Configure columns and layout. Choose which measures appear, such as Committed, Best Case, quota and gap to target. If a column has field-level security, the forecasting system user needs read access in the field security profile.
- Set drill-down entities. Let managers click from a total to the opportunities behind it.
- Review advanced settings. The Advanced step covers multi-currency selection, auto-hide parent row, prediction factors and Kanban as the default view. Multi-currency matters in the Gulf, where deals often mix UAE dirham, Saudi riyal and US dollar.
- Activate and load data. Activate the forecast and let the first calculation run before announcing it to the team.
Where Singleclic fits: our D365 implementation and consultancy services cover configuration, and our D365 customization and integration services connect the forecast to the rest of your systems, so the hierarchy, security roles and currencies are set up once against how your business reports.
Periods and calendars
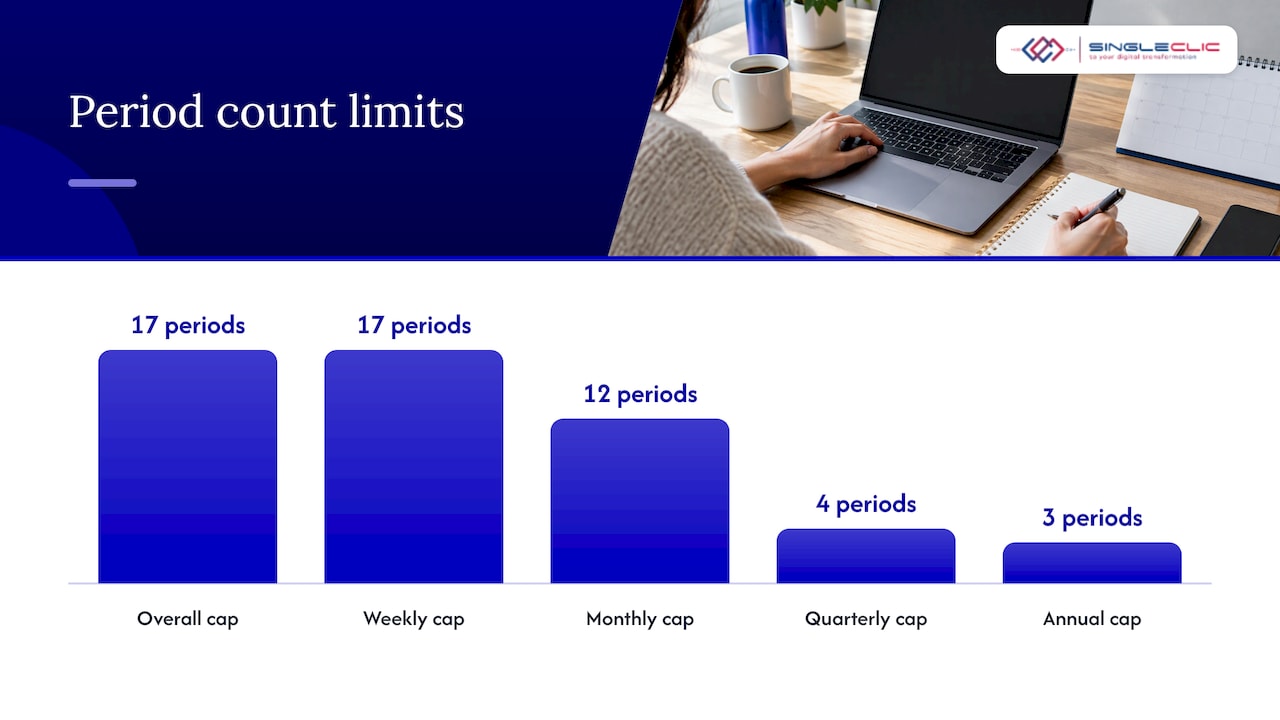
Forecast periods deserve a short design session. Per the period rules, custom periods run from a minimum of 7 days to a maximum of 1 year, and duplicate periods are not allowed. Period counts are capped at 17 overall, 17 weekly, 12 monthly, 4 quarterly and 3 annual.
Scheduling formats include Gregorian, Broadcast Calendar, the 3-3-3-4 family, 4-4-5, 4-5-4, 5-4-4 and Custom. Most Gulf companies plan on the Gregorian calendar with monthly and quarterly periods. Retail and distribution businesses that report on 4-4-5 calendars can mirror that here so the forecast lines up with finance.
Predictive forecasting
Manual categories reflect what sellers believe. Predictive forecasting adds a second view. Microsoft describes it as an AI estimate of how much revenue you will actually close, based on historical performance and the current pipeline. The Prediction column sits beside the manual Committed and Best Case columns, and predictions recalculate automatically every seven days.
The premium forecasting prerequisites are about data, not technology:
- More than 10 closed opportunities with complete field values.
- Open opportunities with Estimated Value and Estimated Close Date filled in.
- Real data that reflects actual usage.
- The required Dynamics 365 Sales license.
If your CRM has been used loosely, the first project is a data clean-up and field-completion standard. For a broader view of how machine learning fits sales planning, see our article on using AI to forecast sales and demand.
Roles and permissions
Plan roles before go-live. According to Microsoft, configuring forecasts requires administration and customization roles, while using sales features requires primary sales roles. Two forecast-specific roles matter:
- Forecast Manager can configure, clone, deactivate, adjust or delete a forecast.
- Forecast user can view forecast and drill-down data.
Keep the Forecast Manager group small. In a government entity or bank, that also supports your internal audit trail.
Reviewing, adjusting and sharing
Sellers and managers pick the forecast from a dropdown, choose a period and drill into the underlying opportunities. Managers can adjust values for things the system has not captured yet, such as a verbal commitment or a deal on pause. The forecast owner can share it with other users in the hierarchy.
Timing is important for anyone reading the numbers:
- Changes on the Forecasts page show immediately.
- Changes made on the Opportunities page show by the end of the day for the current period.
- Past and future periods need a manual recalculation.
The recalculation methods are automatic delta recalculation, automatic full recalculation (daily for the current period, monthly for annual periods) and manual full recalculation at any time.
A useful rhythm: sellers update opportunities by Thursday, managers review and adjust on Sunday morning, and the leadership team reads the rollup at the start of the week. The exact days will depend on your working week, but fix them and keep them.
Troubleshooting a forecast that looks wrong
Microsoft’s forecasting FAQ lists the usual causes when a forecast shows zero or unexpected values:
- Opportunities are outside the hierarchy. Check that deals are assigned to users or territories that sit in the forecast hierarchy.
- Category mismatch. The opportunity’s forecast category must match the columns defined in the layout.
- Data not recalculated. If records were updated on the Opportunities page, trigger a manual recalculation.
- Access not granted. The administrator needs to give the user access to the forecast.
To improve reliability over time, keep data realistic, complete the fields premium forecasting needs, enable predictive opportunity scoring and review the forecast on a fixed cadence.
Use cases for UAE and Saudi organizations
- Real estate and construction: forecast by project or product line, and separate off-plan sales from contracting revenue so each team has its own rollup.
- Healthcare groups: use a territory forecast across clinics or emirates, with managers adjusting for confirmed insurance or corporate contracts.
- Banking and telecom: use the org chart template to roll relationship manager pipelines up to segment heads, with multi-currency enabled.
- Government-linked suppliers: use product forecasts for tender-driven revenue, where Committed means an awarded contract and Best Case means a shortlisted bid.
- Supply chain and HR leaders: the forecast gives supply chain managers an earlier read on demand, and HR a basis for hiring plans. Our piece on Dynamics 365 Supply Chain for MENA covers the master data side.
Forecasting also sits inside a wider CRM program. If you are still shaping that, our guide to Dynamics 365 CRM that is AI-ready and data-driven is the place to start, and the Dynamics 365 implementation playbook covers rollout.
How Singleclic helps
Singleclic is a Microsoft Dynamics 365 integrator serving organizations across Saudi Arabia, the UAE and Egypt, with 70+ consultants and engineers and 100+ enterprise clients across healthcare, banking, real estate and government. Our D365 services include consultancy, implementation, customization, integration, and support and maintenance. For forecasting, that means the hierarchy, roles, columns and currencies are configured against how your executives review the business, and the forecast is connected to your ERP and other systems.
Where approvals and workflows sit around the forecast, our Cortex low-code platform connects approvals, ERP, CRM, data and legacy systems, with a full Arabic interface and on-premise deployment for banks and governments. Explore our Dynamics 365 services or talk to the team about your forecasting design.
If you are planning a rollout in the UAE, read our Dynamics 365 implementation guide for UAE leaders. To start a conversation, contact Singleclic through singleclic.com.
Perspective
Most forecasting projects we see discussed start with screens and end with arguments about whose number is right. We prefer to start with the decision the forecast must support: which hierarchy leadership reads, which deals count as committed, and who may adjust a number.
Dynamics 365 gives you the building blocks: templates, categories, periods, predictions and roles. The value comes when those blocks are tied to your sectors and your systems. A bank, a hospital group and a contractor do not forecast the same way, and the configuration should show that.
That is why we combine Dynamics 365 consultancy, integration and support with Cortex, our Arabic-enabled low-code platform. The forecast stays inside a connected process, from the approval to the ERP record, so the number leadership reads reflects what the business is actually doing.
Tamer Badr
Topic cluster
- Slug: dynamics-365-sales-forecasting
- Primary keyword: Dynamics 365 sales forecasting
- Secondary keywords: forecast configuration in Dynamics 365, predictive forecasting, forecast categories, Dynamics 365 CRM
- Pillar cluster: Dynamics 365 CRM and AI-enabled sales
- Related reading: merging predictive AI with CRM and Microsoft Copilot for Sales
FAQ
What is the difference between Committed and Best Case?
Committed means the customer has given a verbal or contractual commitment, so confidence is high. Best Case means the deal is progressing with medium confidence. Define in writing what evidence moves a deal from one to the other, so every seller classifies deals the same way.
How often does a Dynamics 365 forecast update?
The out-of-the-box forecast updates in near real-time, while a configured forecast updates every 24 hours or on manual recalculation. Predictions in premium forecasting recalculate every seven days. Past and future periods need a manual recalculation.
Can I forecast by product or by territory instead of by manager?
Yes. Dynamics 365 Sales offers org chart, product and territory templates, and you can build a forecast from scratch. Choose the one that matches how your leadership reviews targets, then configure the hierarchy to suit.
What data does predictive forecasting need?
Microsoft lists more than 10 closed opportunities with complete field values, open opportunities with Estimated Value and Estimated Close Date, and data that reflects real usage. A specific Dynamics 365 Sales license is also required. Complete fields are the quickest improvement to make.
Why does my forecast show zero?
The usual causes are opportunities outside the forecast hierarchy, a category that does not match the layout columns, no recalculation after edits on the Opportunities page, or missing access. Check the hierarchy first, then trigger a manual recalculation. Singleclic can help review the configuration.
Sources
- Sales forecasting overview, Microsoft Learn
- Capture forecast category for opportunity, Microsoft Learn
- Configure forecasts in your organization, Microsoft Learn
- View and manage a forecast, Microsoft Learn
- Select a template to configure forecasting, Microsoft Learn
- Configure forecast using custom rollup entity, Microsoft Learn
- Configure advanced settings for a forecast, Microsoft Learn
- Forecast period rules and scheduling formats, Microsoft Learn
- Analyze revenue outcome using predictive forecasting, Microsoft Learn
- Enable premium forecasting, Microsoft Learn
- Forecast recalculation methods, Microsoft Learn
- Forecasting management FAQs, Microsoft Learn